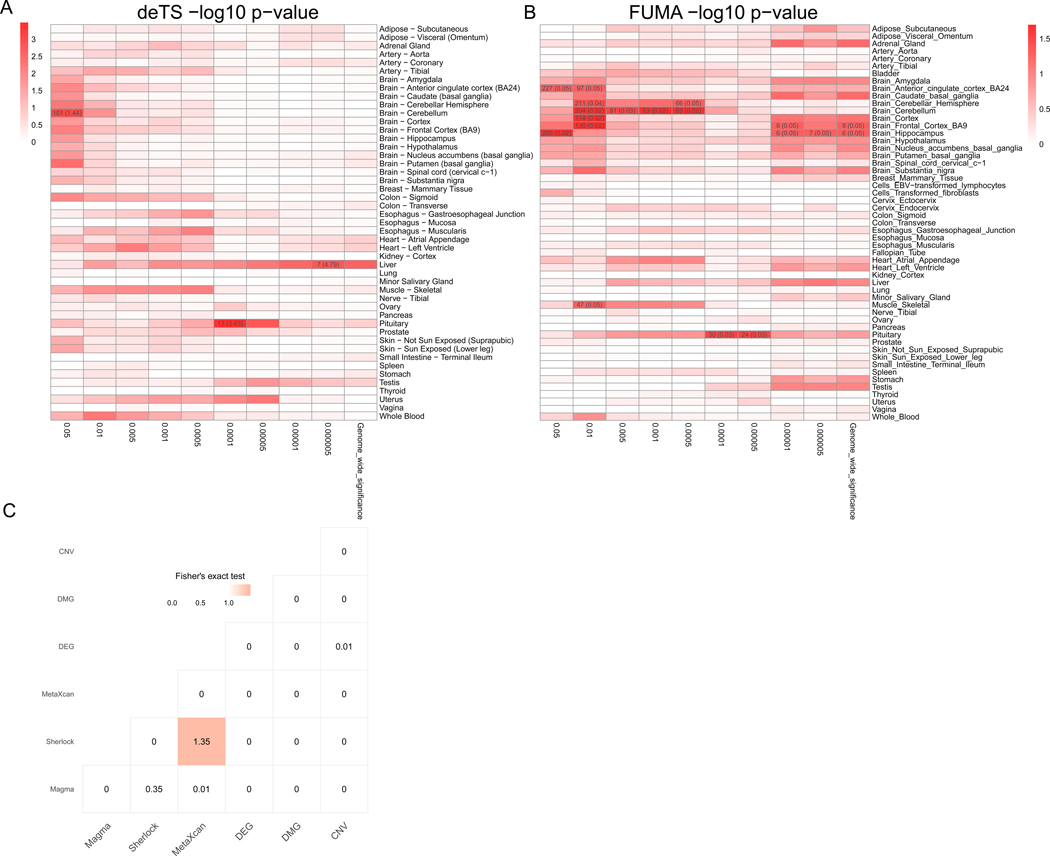
Figure 1. Overview of the multidimensional data for Alcohol use disorder (AUD) study.
(A) Tissue-Specific Enrichment Analysis (TSEA) of Magma genes. X-axis: groups of genes defined at different thresholds based on Magma p-value. Y-axis: 47 GTEx tissues used as the reference panel. Cells were highlighted in red proportional to the corresponding p-values. Cells with Bonferroni correction significance were further annotated with the numbers in each cell represented the number of shared genes between the Magma genes and the tissue-specific genes, followed by the odds ratio in braces. (B) FUMA tissue-specific enrichment analysis of Magma genes. X-axis: groups of genes defined at different thresholds based on Magma p-value. Y-axis: 53 GTEx tissues used as the reference panel. Cells were highlighted in red proportional to the corresponding p-values. Cells with nominal p value < 0.05 were further annotated with the numbers in each cell represented the number of shared genes between the Magma genes and the tissue-specific genes, followed by the raw p value in braces (C) Pair-wise comparison of the six types of omics data. The -log10 (p-value) from Fisher’s exact test was labeled for each cell. The shade of the cell was proportional to the p-value.

