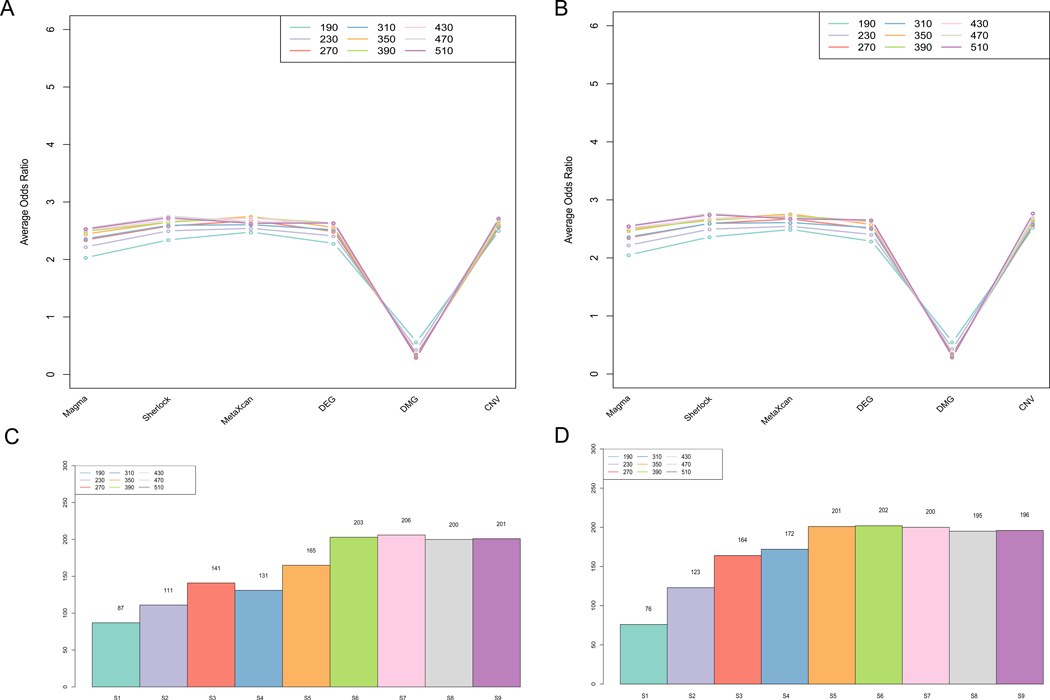
Figure 2. Summary of AUD candidate genes identified by MegaOR.
(A) Odds Ratio (OR) distribution for each type of evidence in each set size for the evidence matrix with 998 genes in 100 runs. Each dot indicates the average OR in the corresponding evidence type from 100 sets resulted from MegaOR (see main text). (B) OR distribution in 1000 runs. (C) Distribution of AUDgenes at the stable stage for each set size in 100 runs. (D) Distribution of AUDgenes at each set size in 1000 runs.

