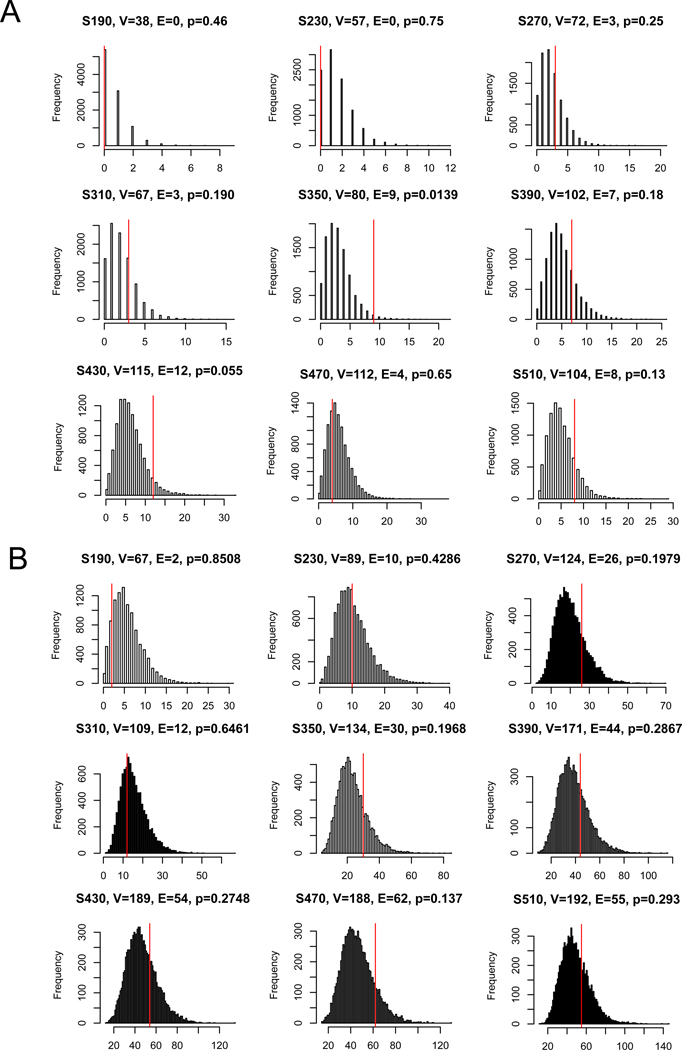
Figure 3. Distribution of protein-protein interactions (PPIs) among AUDgenes.
The analysis was conducted using the MAGI (A) and influence graph reference panel (B). In each panel, the distribution of the intersections was displayed for 10,000 randomly selected gene sets, each with the same set sizes as the query set. X-axis is the number of interactions. Y-axis is the frequency of the interactions. In the title of each panel, V denoted the number of AUDgenes that were annotated in the corresponding PPI network; E denoted the number of interactions among these AUDgenes; and the p-value was the empirical rank p- value. The vertical red line indicates the number of interactions observed for the actual AUDgenes.

