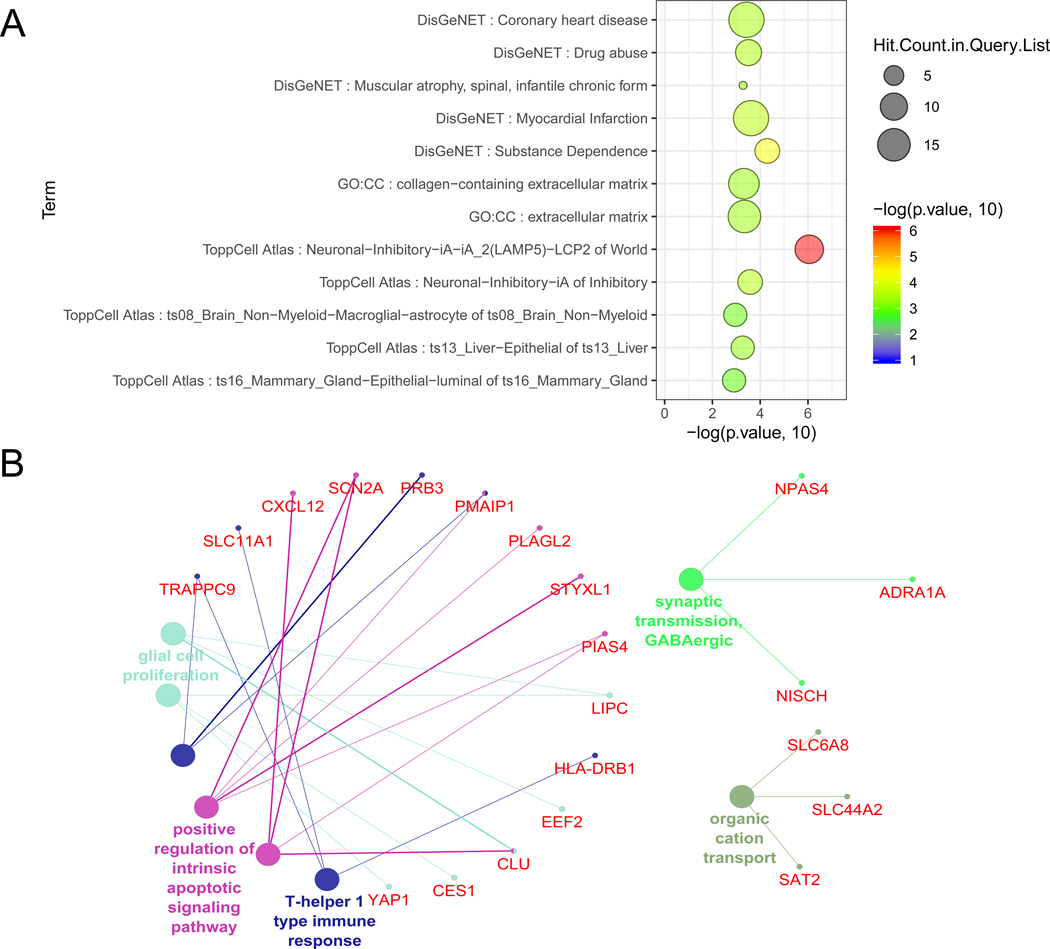
Figure 4. Functional enrichment analysis of the AUDgenes.
(A) Bubble plot of the functional enrichment results using 206 AUDgenes obtained. X-axis was the –log10 (raw p-value). Y-axis indicated the enriched gene sets with FDR < 0.10. Circle size was proportional to the shared AUDgenes with genes from the corresponding gene set. Circle color was proportional to the raw p-value. (B) Enrichment analysis results using the ClueGO method in Cytoscape for GO Biological Process [37]. Each dot represented a gene (name in red) or a GO term (name in other colors). Dots in the same color were considered from the same functional group by ClueGO annotation. Each edge indicated the gene was a component gene of the linked GO term.

