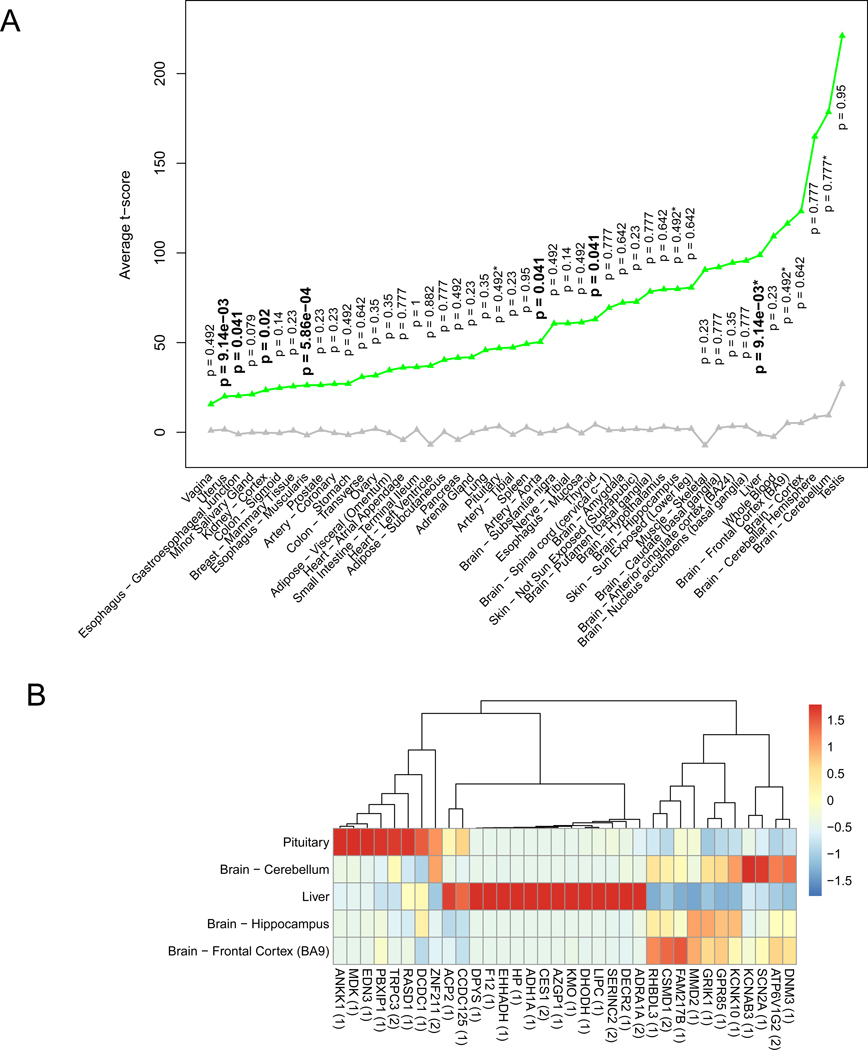
Figure 5. AUDgenes tissue enrichment analysis.
(A) Line chart for the average t-scores of tissue- specificity for 206 AUDgenes. The t-score was pre-calculated by the deTS package to measure tissue specificity for each gene. X-axis was the 47 tissues; y-axis was the average t-scores for the AUDgenes in each tissue. Green triangles represented AUDgenes and grey triangle for the other genes in the corresponding tissue. Tissues were ordered by the mean t-scores of the AUDgenes. P-values along the green triangle were from the tissue-specific enrichment analysis for each tissue, with significant ones in bold (Benjamini–Hochberg adjusted p < 0.05). *: the five AUD-related tissues. (B) Heatmap of the shared genes between 206 AUDgenes and tissue-specific genes from five tissues (liver and brain cerebellum, frontal cortex BA9, hippocampus, and pituitary). RPKM values of genes were normalized across the five tissues. The number in the bracket after each gene symbol indicated the number of lines of evidence that the gene had in the evidence matrix.

