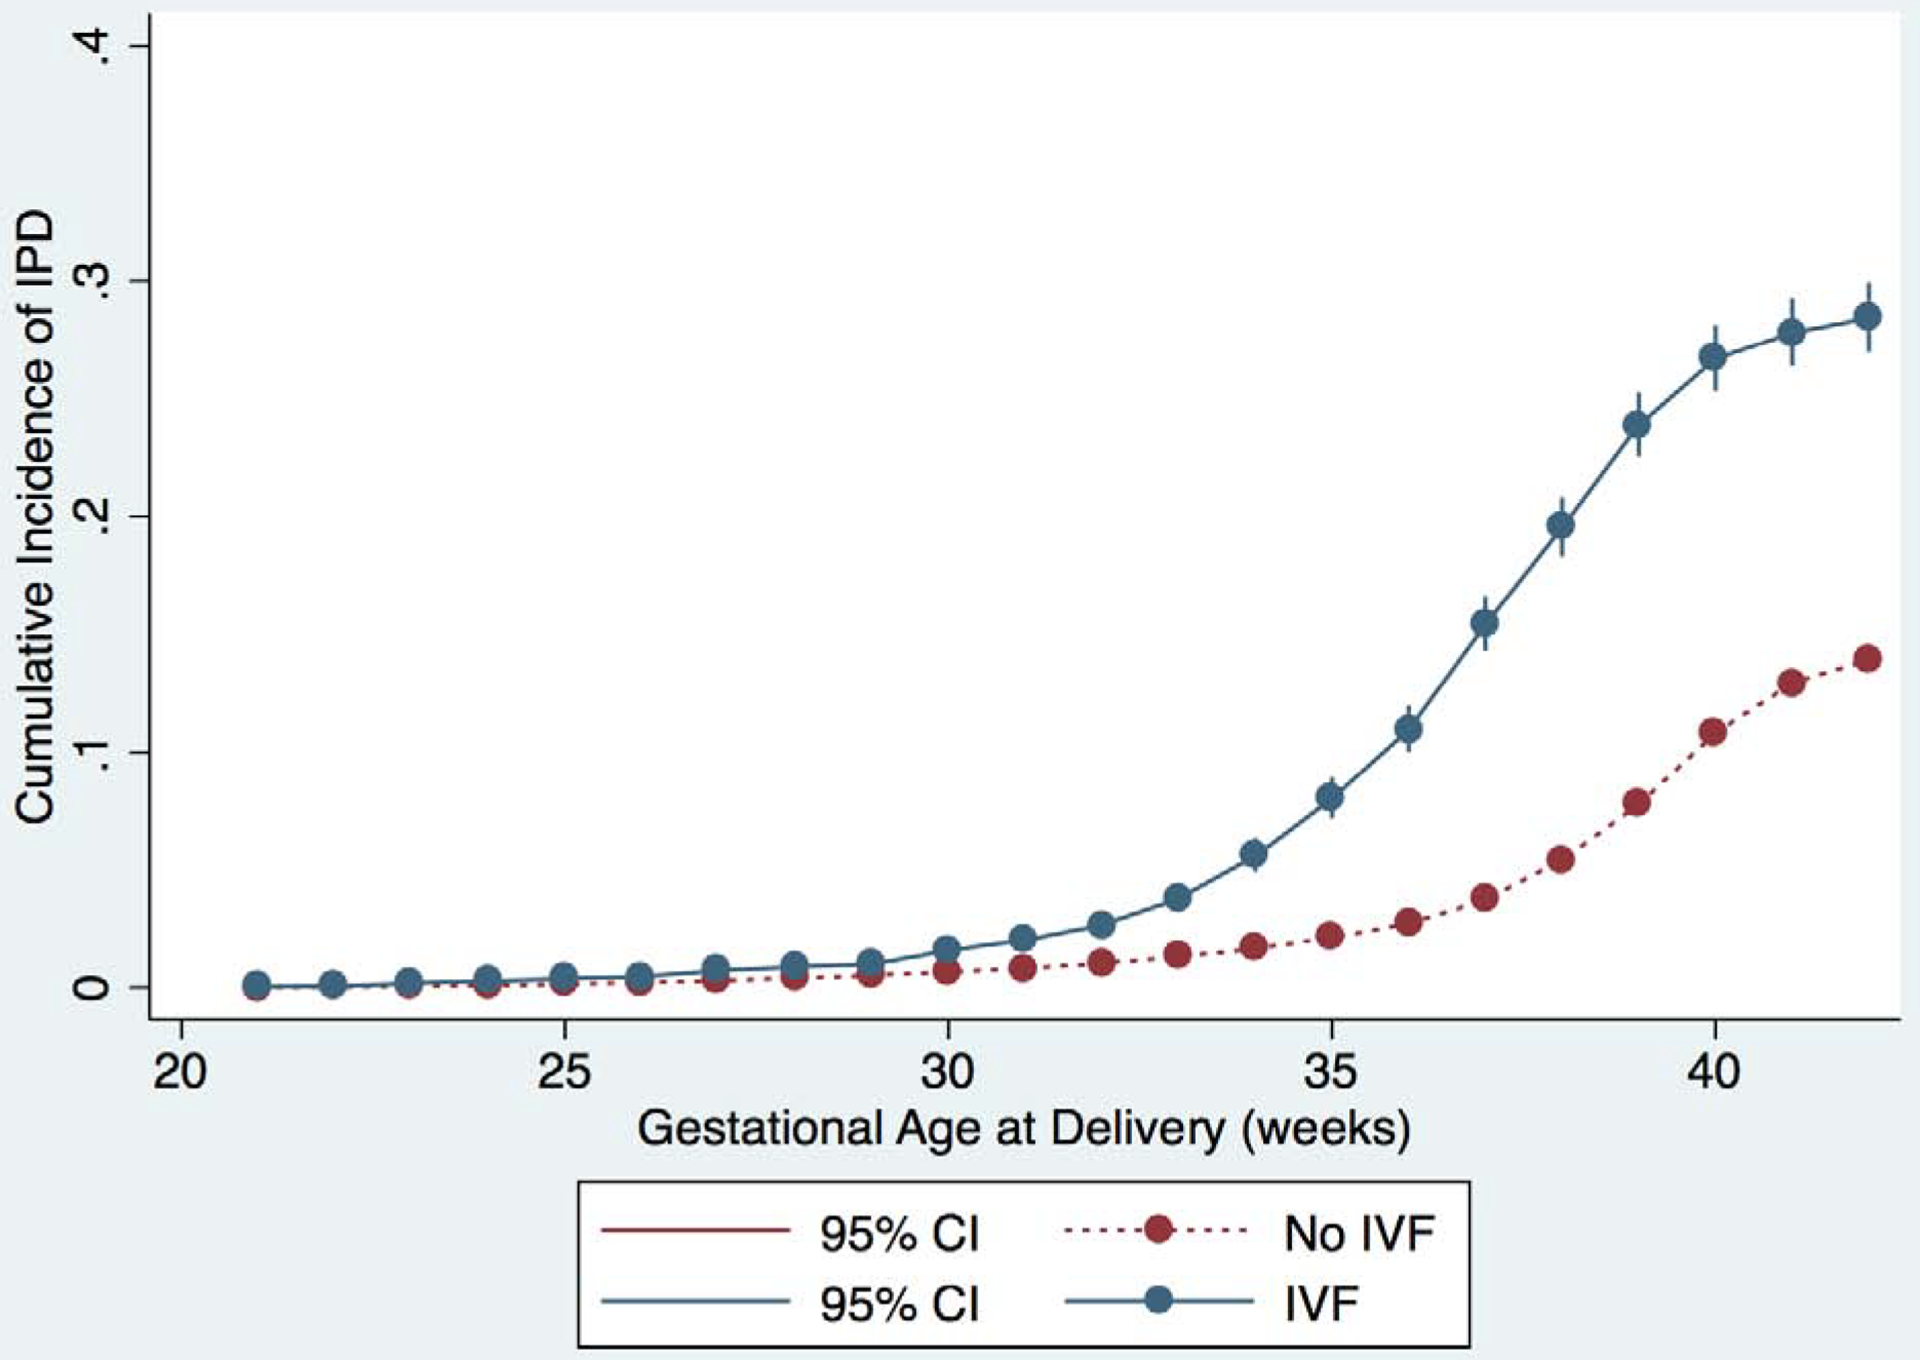
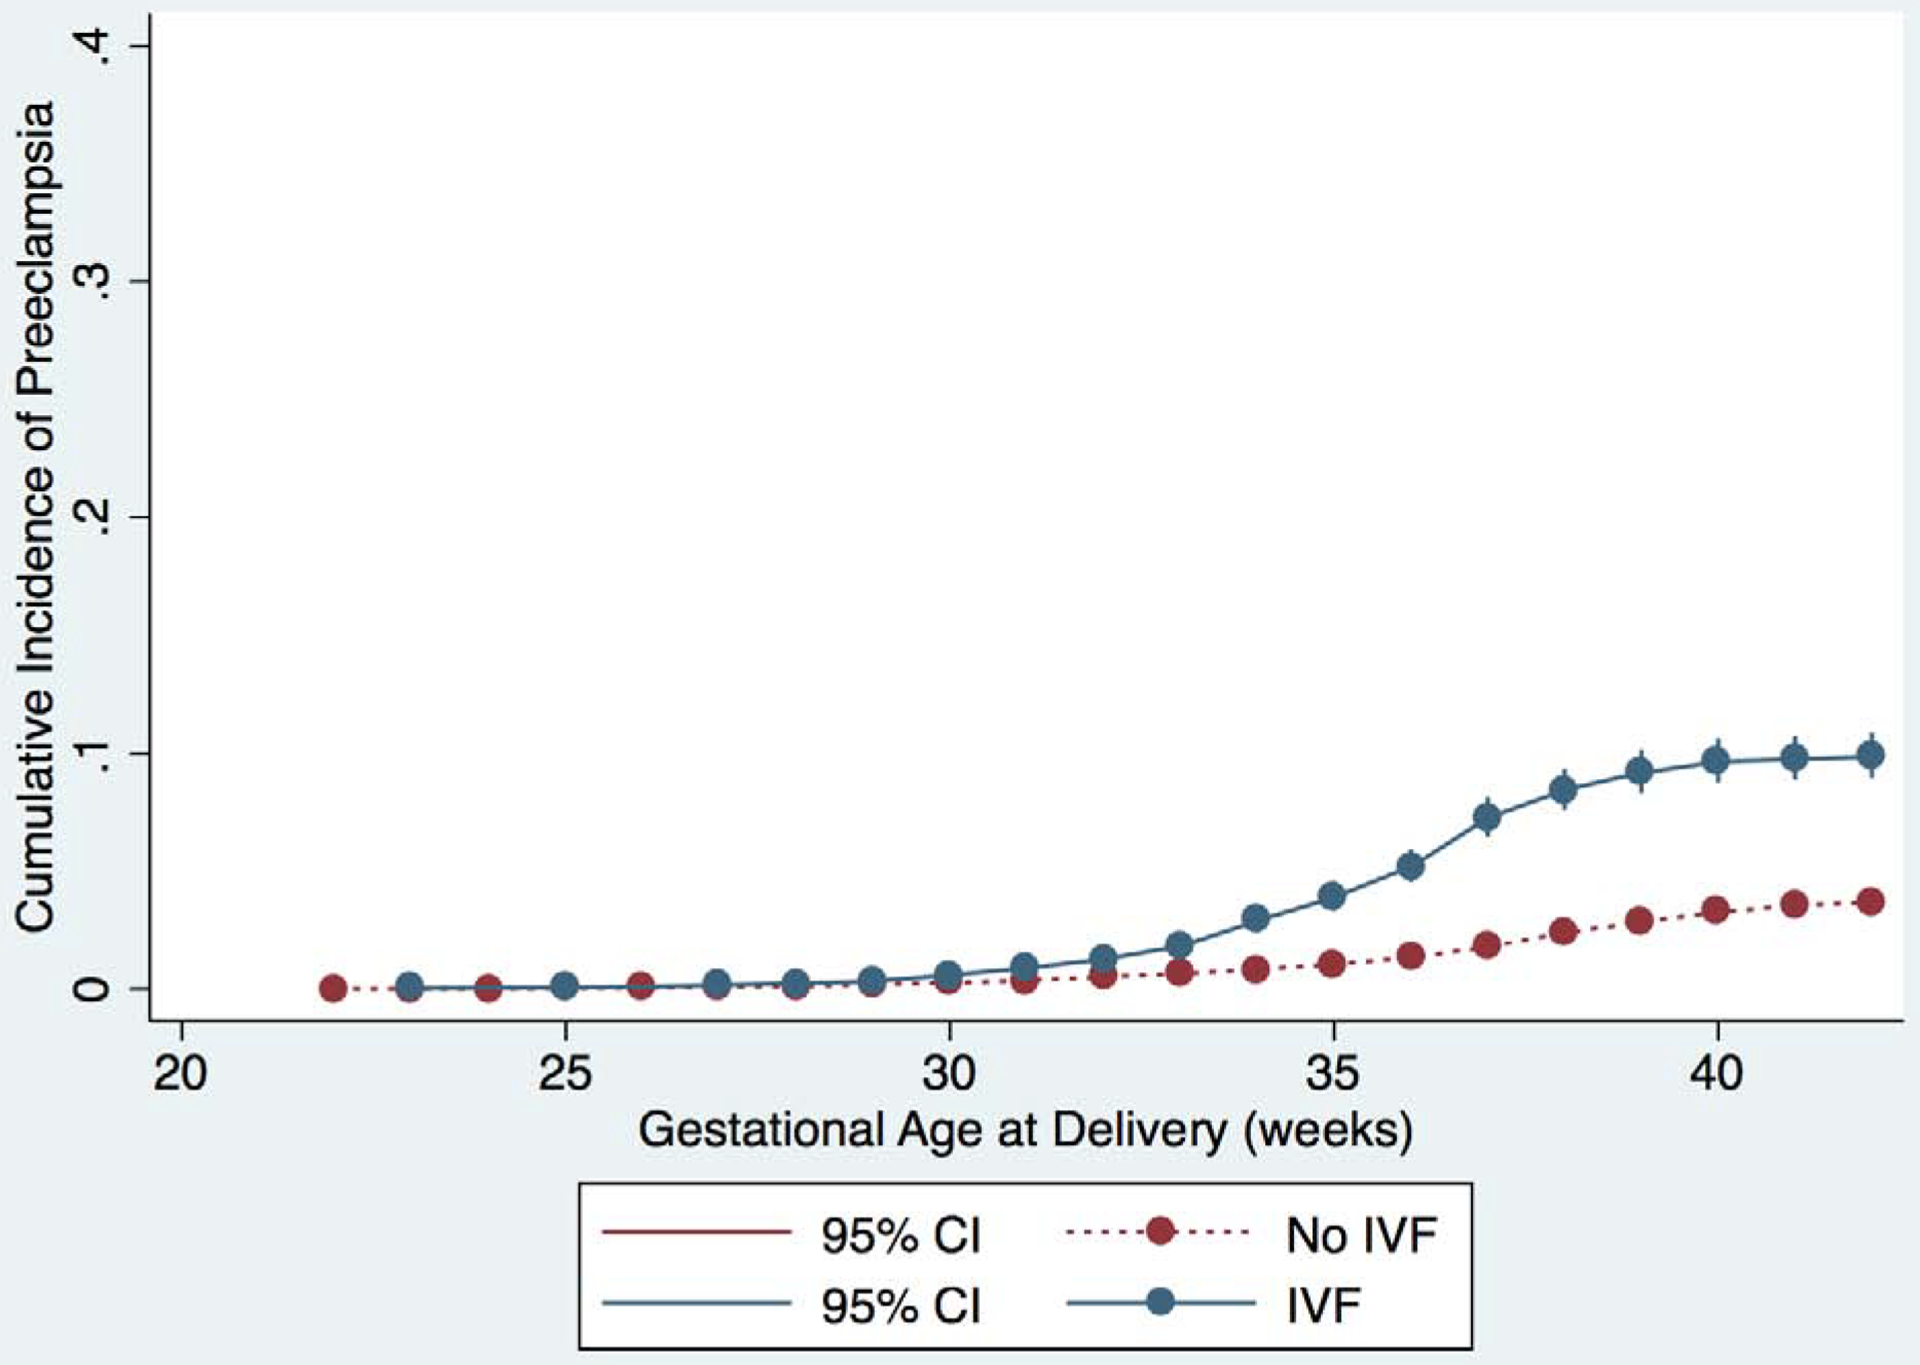
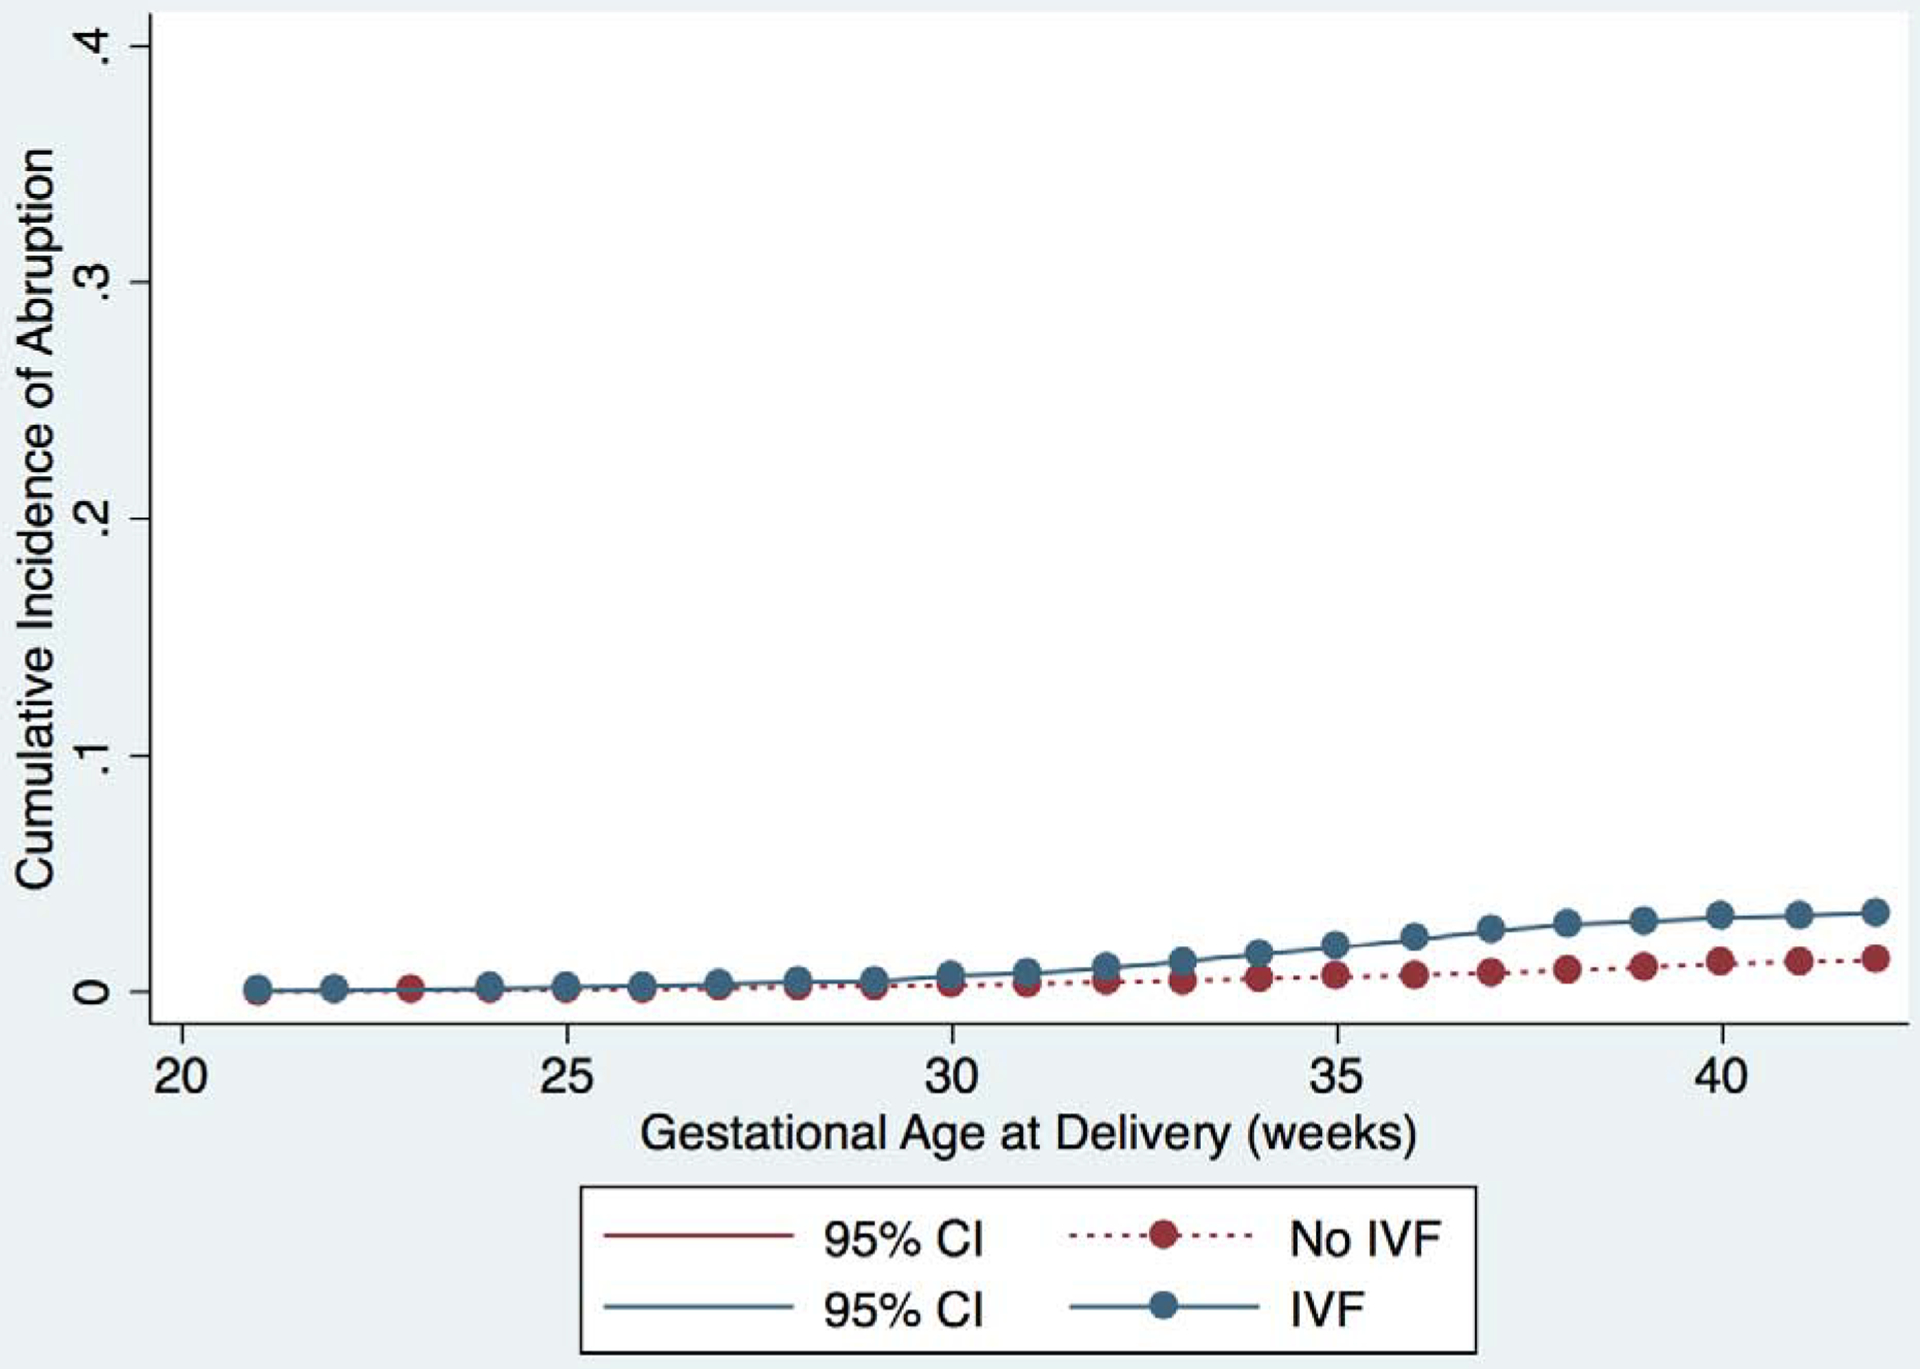
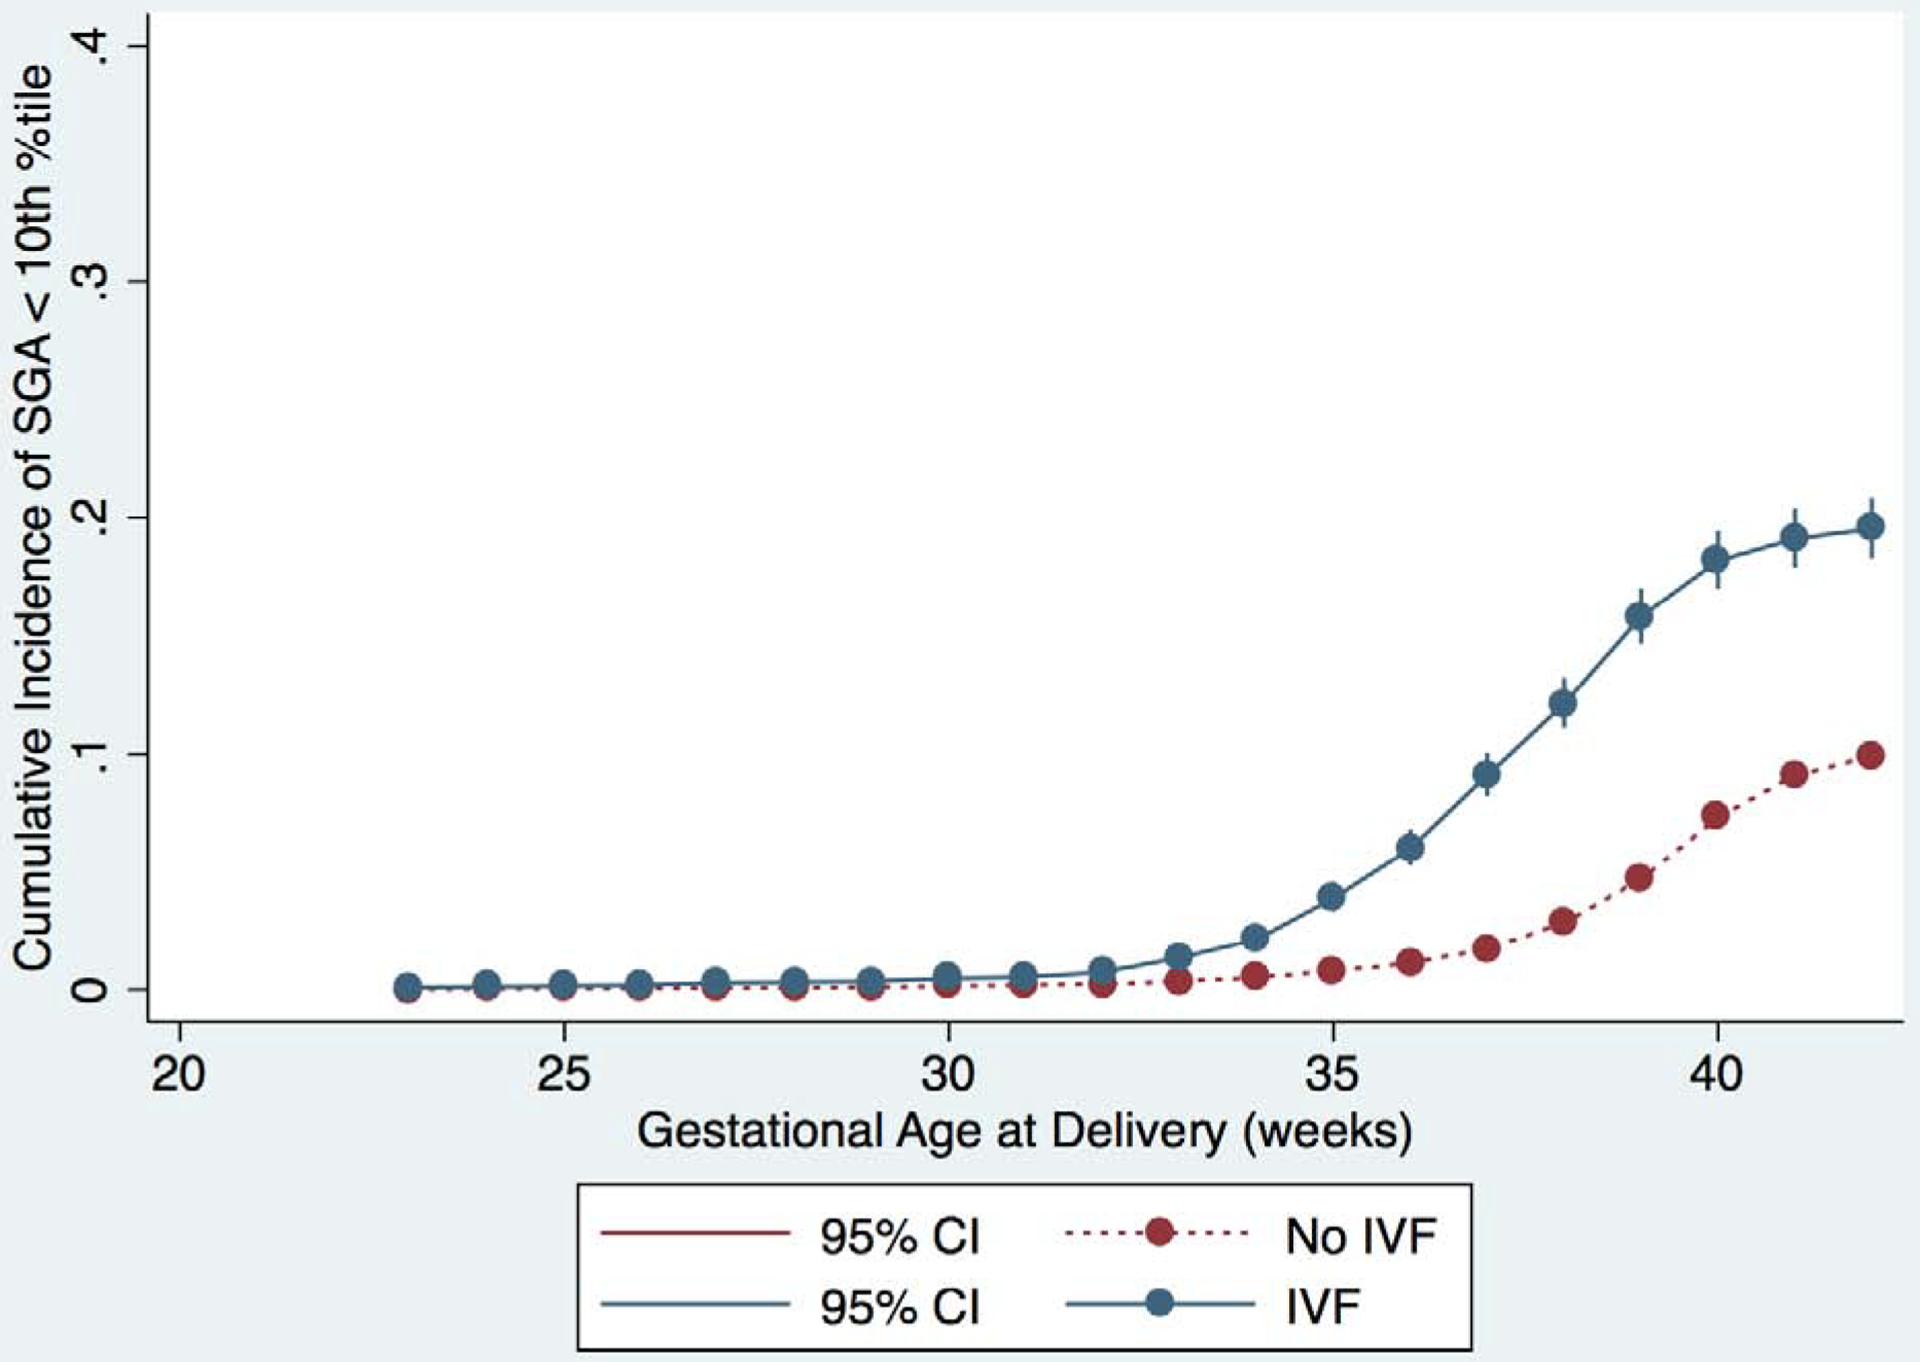
Figure 1:


Cumulative incidence of outcomes for IVF (blue) and non-IVF (red) pregnancies. Curves represent incidence of the primary and secondary outcomes at each gestational age, and outcomes are represented separately in each graph as follows: A) IPD or IUFD from placental insufficiency, B) preeclampsia, C) abruption, and D) SGA <10th percentile. 95% confidence intervals are shown in brackets on each curve.
