
Figure 1.
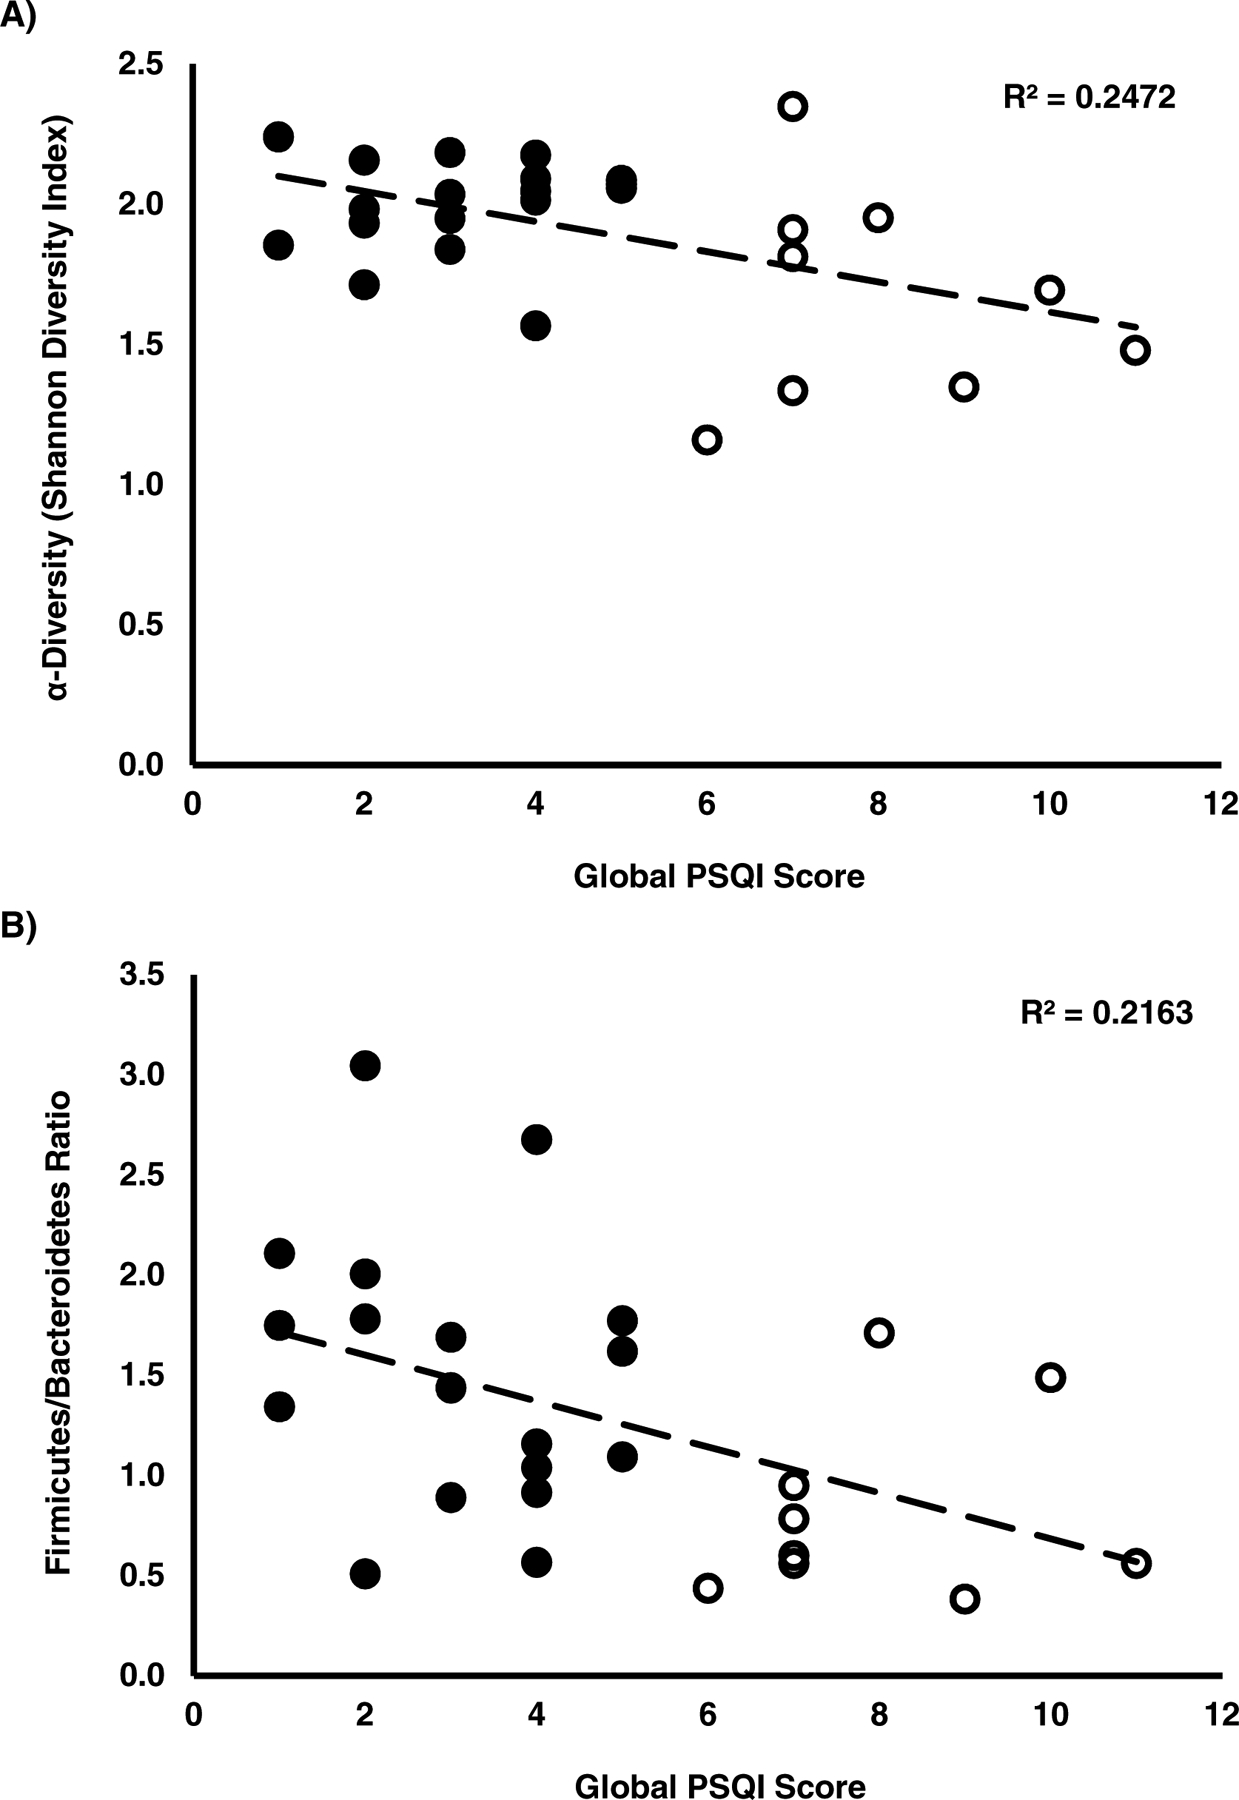
Scatterplots showing associations of the global Pittsburgh Sleep Quality Index (PSQI) score with A) Alpha diversity (Shannon’s Diversity Index) and B) Firmicutes/Bacteroidetes ratio. Black dots represent “normal” sleepers, characterized by a global PSQI score between 0–5, whereas white dots represent “poor” sleepers with a PSQI score > 5 [24]. Trendlines consider all data points.