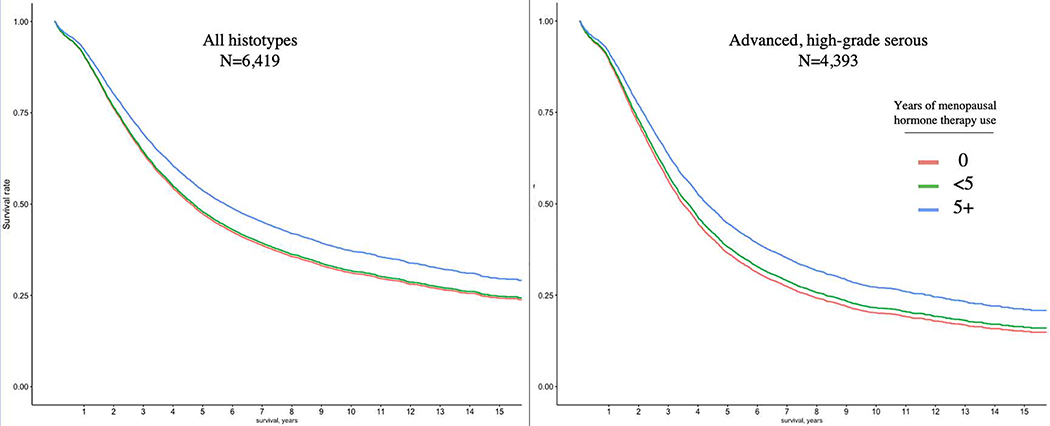
Figure 1: Overall survival stratified by years of menopausal hormone therapy use.
Adjusted survival curves among all women with ovarian cancer (n=6,419) and among women with advanced stage, high-grade serous cancer (n=4,393). The adjusted survival curves are generated from the hazard ratios estimated from a cox proportional hazards model of menopausal hormone therapy use and are adjusted for age at diagnosis, race/ethnicity, histotype (left panel only), stage at diagnosis, and OCAC site.

