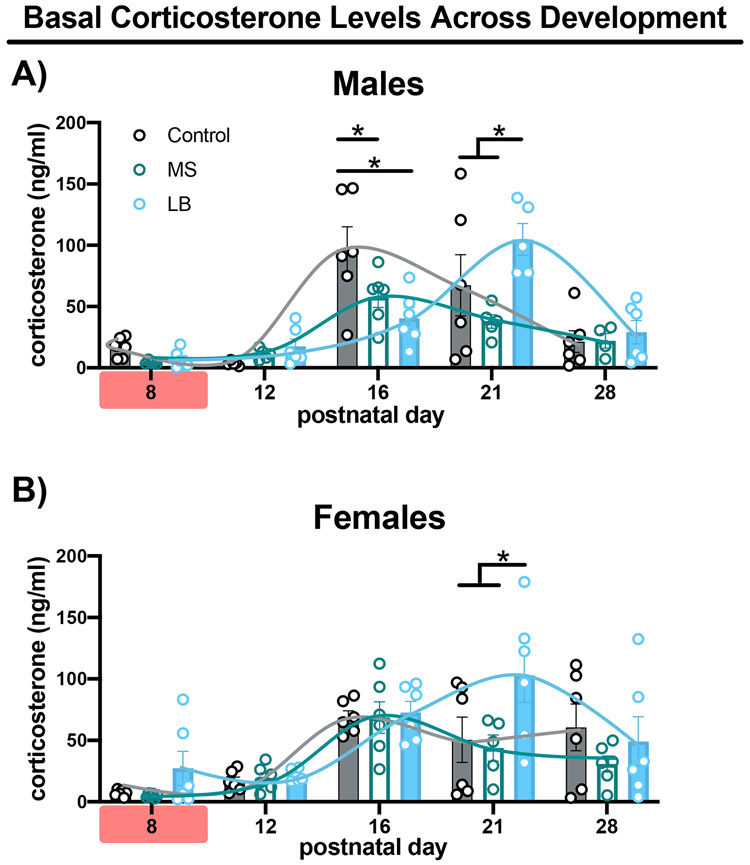
Figure 5-. Type of ELA alters basal corticosterone levels.
Bar graphs depict mean corticosterone levels at PD8, PD12, PD16, PD21, PD28 in male (A) and female (B) mice reared in control (gray-filled), MS (green-unfilled) or LB (blue-filled) conditions. Curves represent summary data. Red highlighter on x-axis indicates ELA being experienced. All bars depict mean, standard error of the mean and individual data points. * Tukey’s LSD p<0.05

