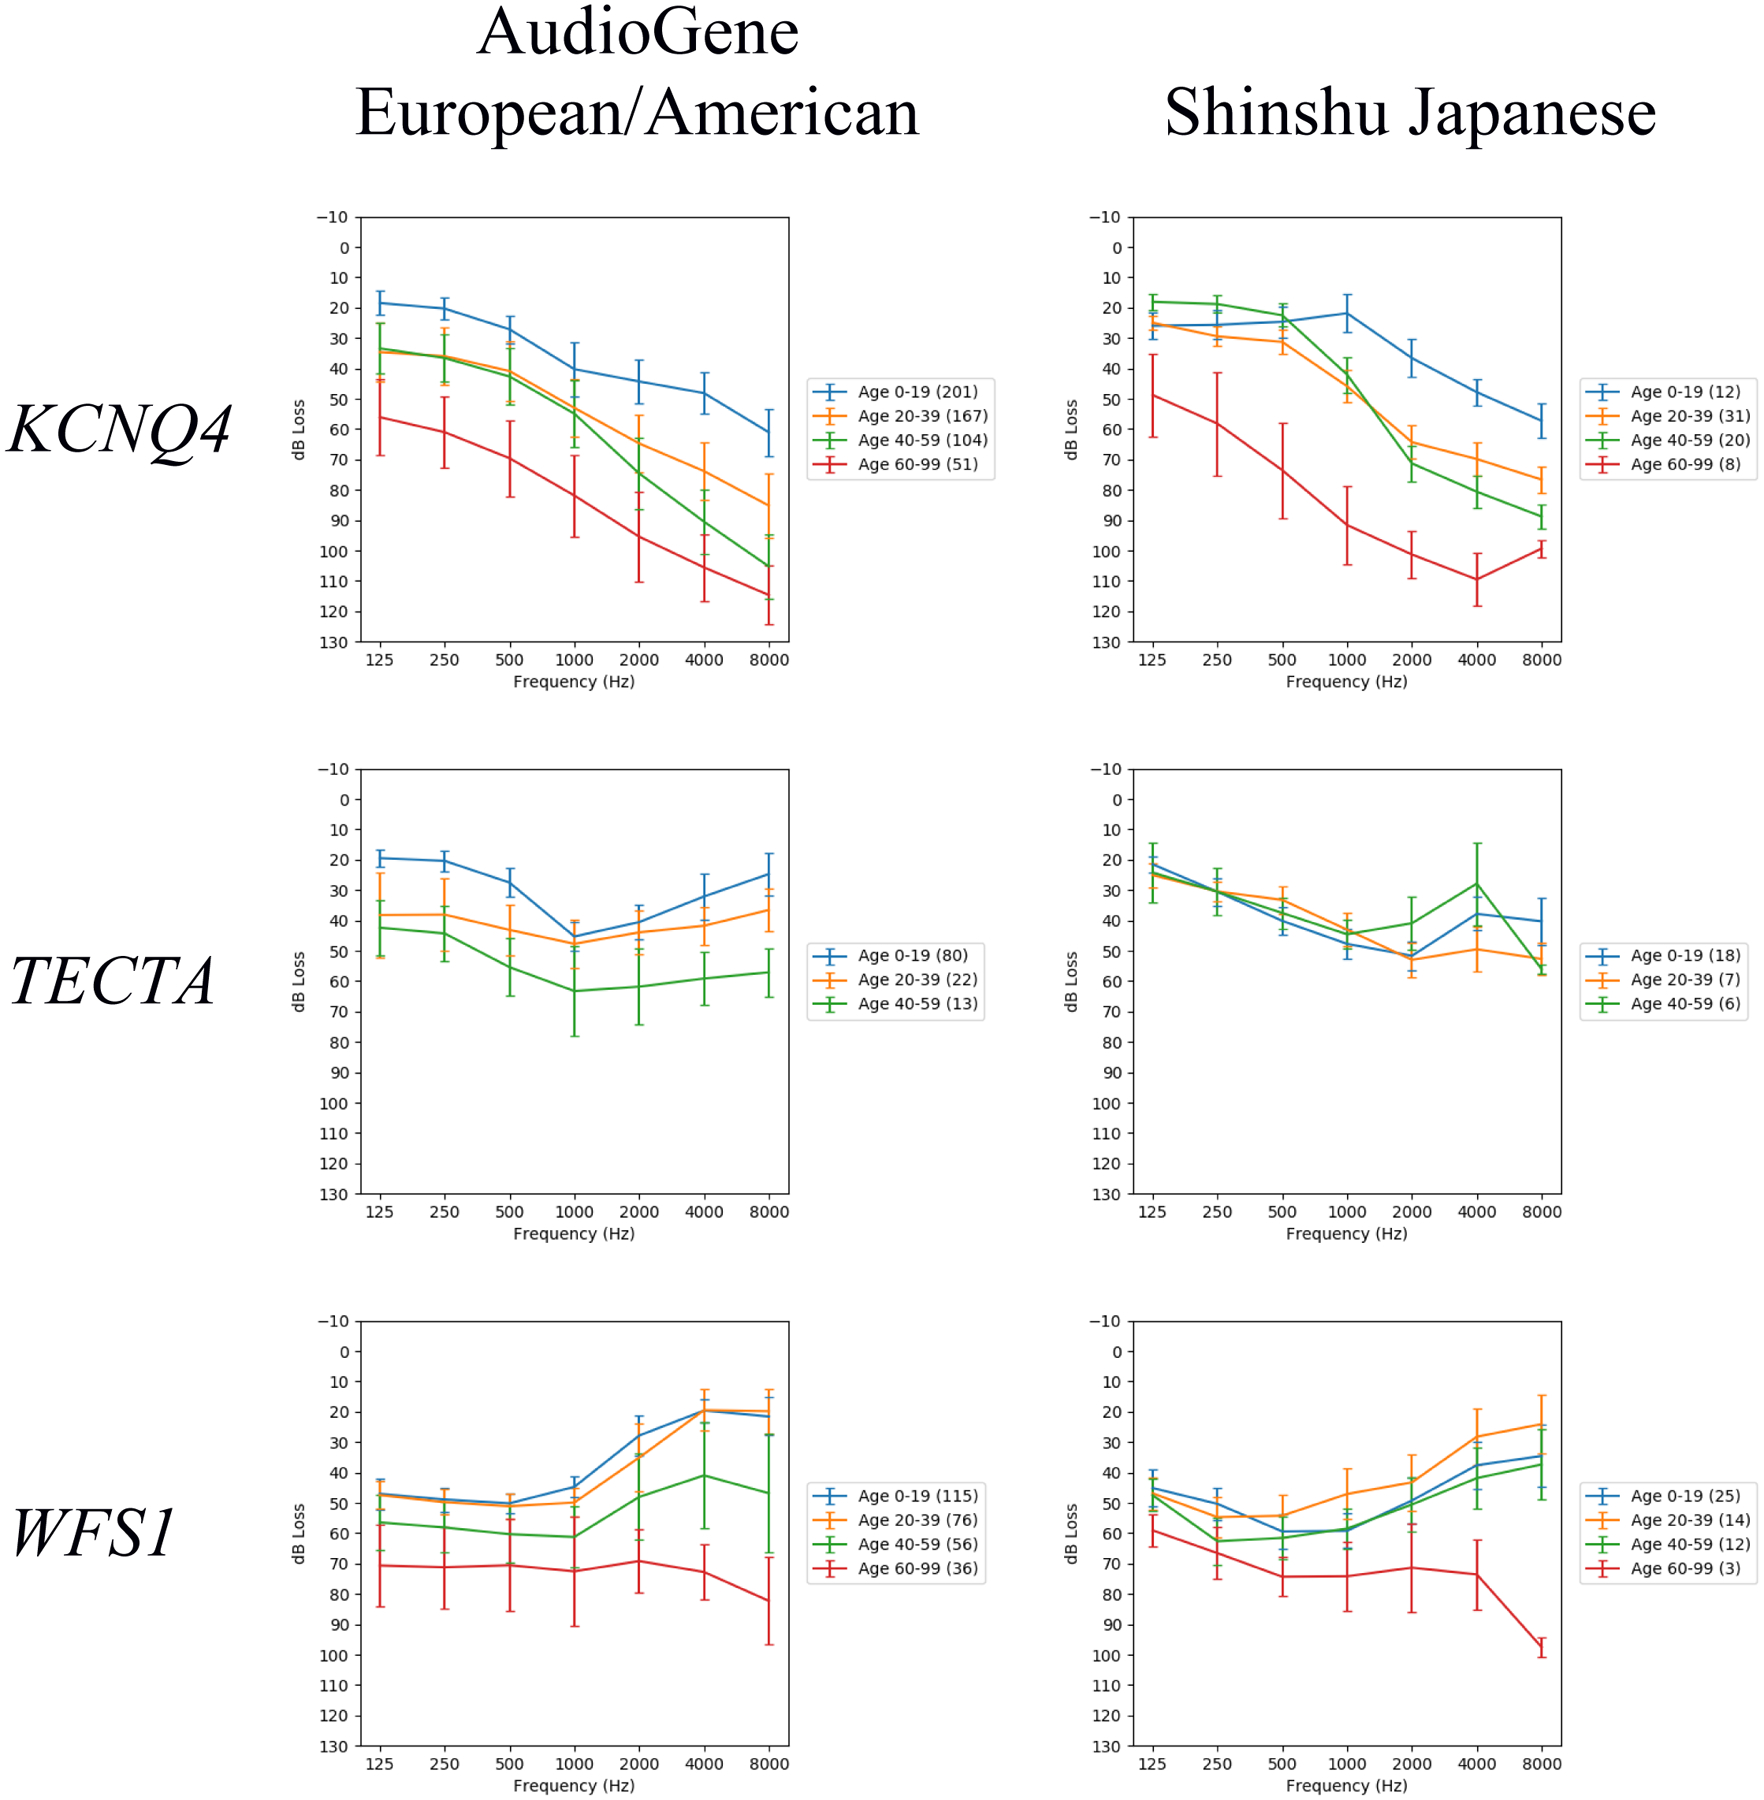
Fig. 1.

Audioprofiles for each pairing of population (European/American, Japanese) and gene (KCNQ4, TECTA, WFS1). The vertical bars indicate standard error of the mean. The number of audiometric test results within each age range is indicated in the legend by the numbers in parentheses. These audioprofiles are each the average of 1000 audioprofiles generated by random family member sampling.
