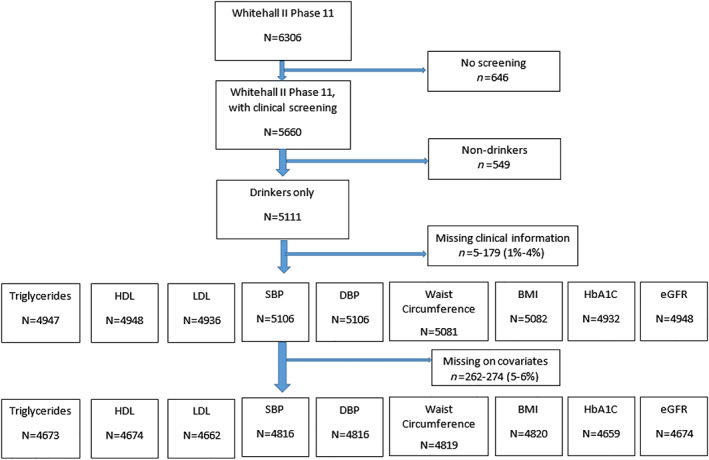
Figure 1.

Flow diagram of included participants in analytical sample. BMI = body mass index; DBP = diastolic blood pressure; eGFR = estimated glomerular filtration rate; HbA1C = glycated haemoglobin; HDL = high‐density lipoprotein; LDL = low‐density lipoprotein; SBP = systolic blood pressure. [Colour figure can be viewed at wileyonlinelibrary.com]
