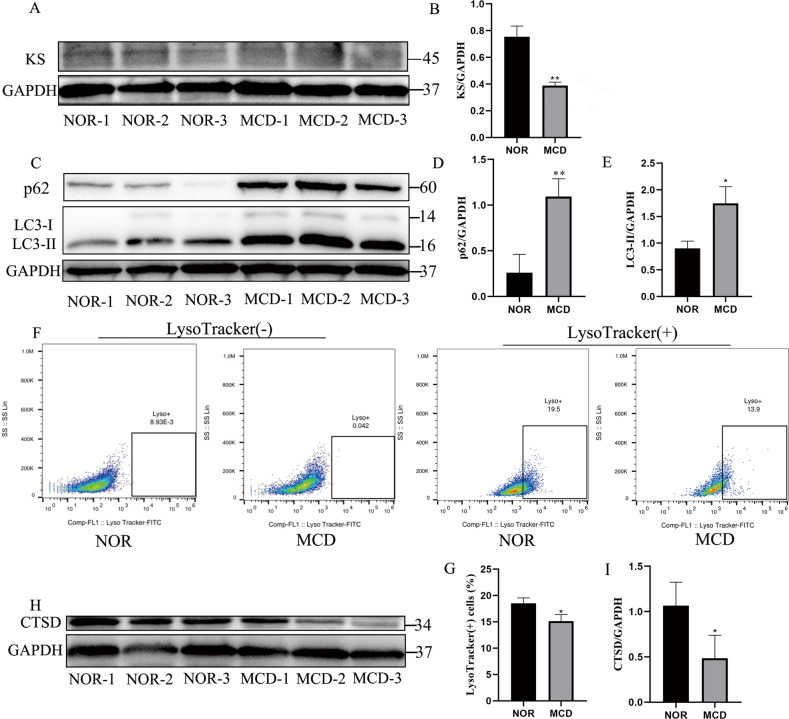
Fig. 1. Sulfated keratan sulfate synthesis and lysosome function in normal (NOR) and MCD keratocytes.
We analyzed three cell lines of various MCD patients (MCD-1, MCD-2, and MCD-3) and three cell lines of various NOR controls (NOR-1, NOR-2, and NOR-3). Western blot analyses of expression of sulfated KS in NOR and MCD keratocytes (a). **p < 0.01 versus NOR keratocytes; Student’s t test; n = 3 derived from each of three lines (b). Expression of p62 and LC3-II without any H2O2 stimulation in NOR and MCD keratocytes (c). *p < 0.05, **p < 0.01 versus NOR keratocytes; Student’s t test; n = 3 derived from each of three lines (d, e). FACS analysis of lysosome function using LysoTracker Green. #P < 0.05, NOR vs. MCD; Student’s t test; n = 3 derived from each of three lines (f, g). CTSD protein level was measured using western blot in NOR and MCD keratocytes (h). *p < 0.05 versus NOR keratocytes; Student’s t test; n = 3 derived from each of three lines (i). Error bars indicate SD.

