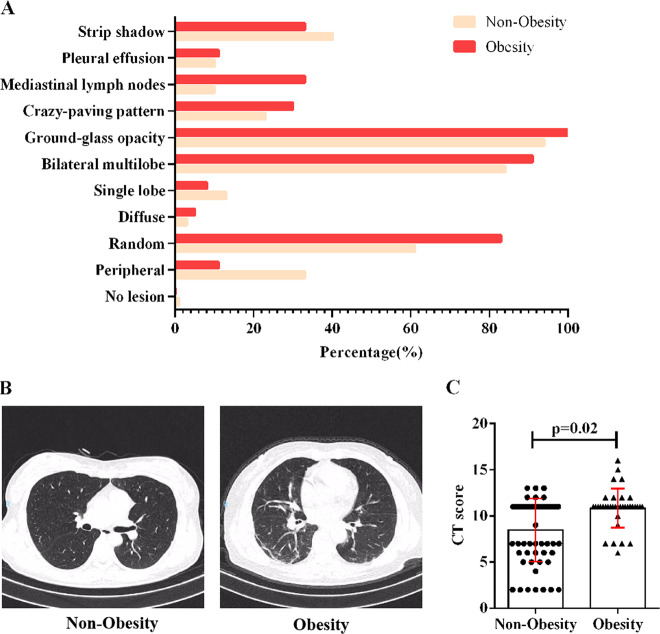
Fig. 2. CT result in the obesity patients and non-obesity patients.
a The frequency of lung injury distribution of the obesity and non-obesity patients. b The representative CT images of the obesity and non-obesity patients patients. c The CT score of the obesity and non-obesity patients. P < 0.05 was considered statistically significant.

