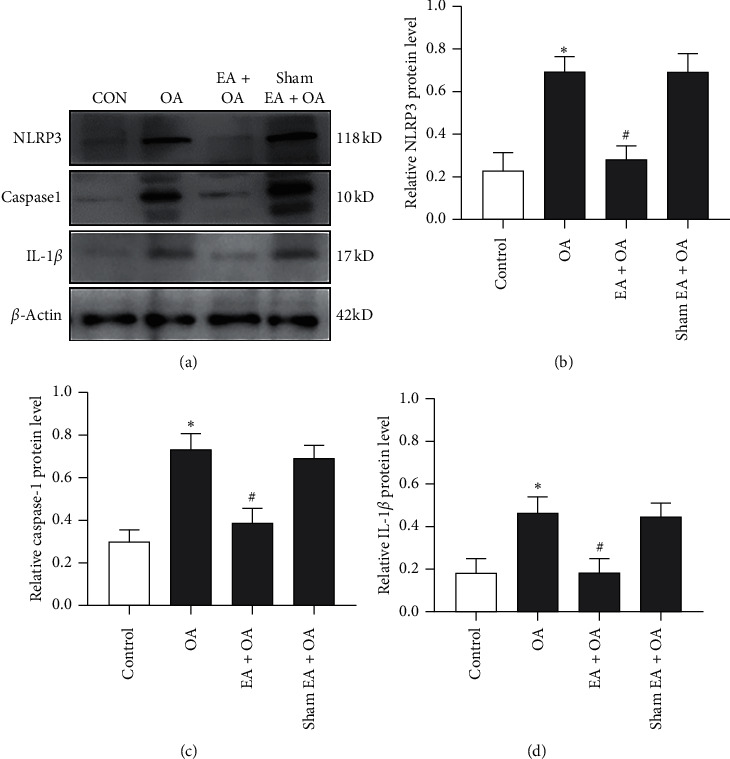
Figure 3.

Expression of NLRP3, caspase-1, and IL-1β in the cartilage tissue of the four groups. (a) Representative results of Western blot for NLRP3, caspase-1, and IL-1β expression in the cartilage tissue of the four groups. (b–d) Immunoblot analysis of NLRP3, caspase-1, and IL-1β in the cartilage tissue of each group (n = 6, ∗P < 0.05 OA group vs. control group. #P < 0.05 EA + OA group vs. OA group).
