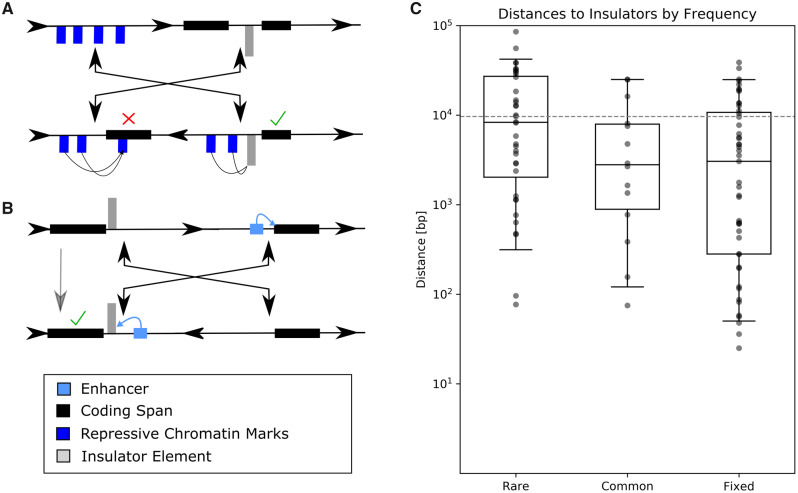
Fig. 3.
—(A) Insulators could prevent chromatin repression across inversion breakpoints. This pair of hypothetical inversions has four breakpoints that do not disrupt gene spans. The left inversion breakpoint is in a repressive gene-free chromatin landscape indicated by blue chromatin marks, whereas the other is between two genes separated by an insulator element. After inversion, repressive chromatin marks are relocated to be adjacent to one of the genes, but their repressive effect is blocked by the insulator. The check mark indicates normal gene expression, whereas the cross indicates disrupted gene expression. (B) Insulators block enhancer activity. This simple example displays how an inversion may translocate an enhancer into the proximity of a new gene. In this example, the enhancer’s activity is blocked by the presence of an insulator, in gray. (C) Higher population frequency correlates with insulator proximity. The distributions of distances are from breakpoints to the nearest insulator element. Note that the y axis is a logarithmic scale. The dashed gray line is the expected median distance of a random breakpoint model.

