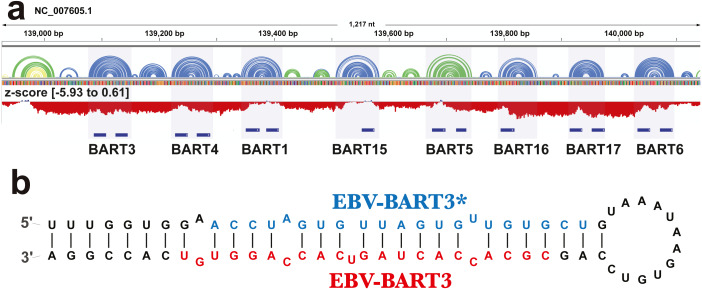
Figure 1. Results for the EBV-BART miRNA cluster.
(A) IGV visualization of results. EBV-1 genome coordinates are followed by ScanFold-Fold predicted base pairs represented as arcs (colored blue and green for bp with average z-score < − 2 and −1, respectively, and yellow for bp with negative average z-scores > − 1), and the genome sequence (A, C, G, and T are in green, blue, orange and red, respectively). Below this is a bar-graph showing the window z-score values predicted by ScanFold-Scan (each bar sits at the 1st nt of the window and is colored red or blue for negative/positive values, respectively; the range of values are indicated in brackets). A cartoon of the gene structure of EBV-1 is shown in blue with the location of BART miRNAs annotated. (B) At the bottom is the ScanFold-Fold secondary structure model for the EBV-BART3 pre-miRNA hairpin. Mature sequences are annotated in blue and red.

