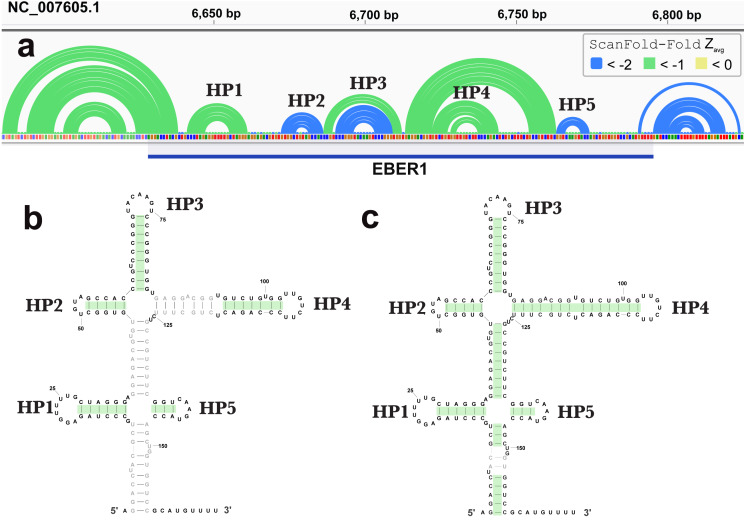
Figure 3. Results for EBER1.
(A) IGV visualization of results. At the top of IGV, EBV-1 genome coordinates are shown, followed by ScanFold-Fold predicted base pairs represented as arcs and the location of EBER1 is indicated by the blue cartoon. Base pairs in the reference EBER1 structure correctly predicted by ScanFold-Fold are highlighted in green on the secondary structure in (B). (C) indicates the correctly predicted pairs after refolding the EBER1 sequence using ScanFold-Fold bp with average z-scores < − 2 as constraints.

