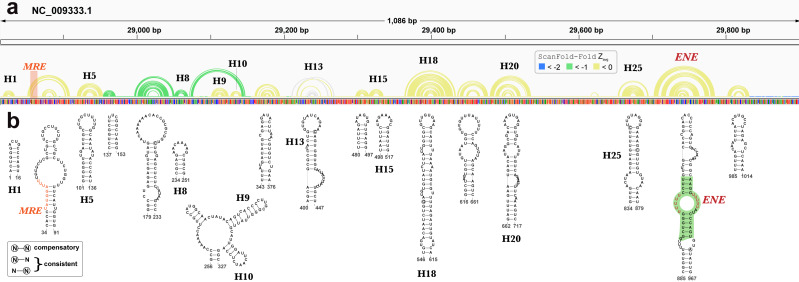
Figure 8. Results for KSHV PAN.
(A) IGV visualization of results with KSHV genome coordinates followed by ScanFold-Fold predicted base pairs represented as arcs (colored green for bp with average z-score < − 1, yellow for bp with negative average z-scores > − 1, and grey for >0), the genome sequence (A, C, G, and T are in green, blue, orange and red, respectively). (B) The bottom panel contains motif secondary structures predicted by ScanFold-Fold depicted using VARNA (Darty, Denise & Ponty, 2009). The MRE is represented as an orange highlight on the arc diagrams and as orange bps in the secondary structures. The nucleotides from the ENE motif which have been crystalized (Mitton-Fry et al., 2010) are highlighted in green.

