
Fig. 1.
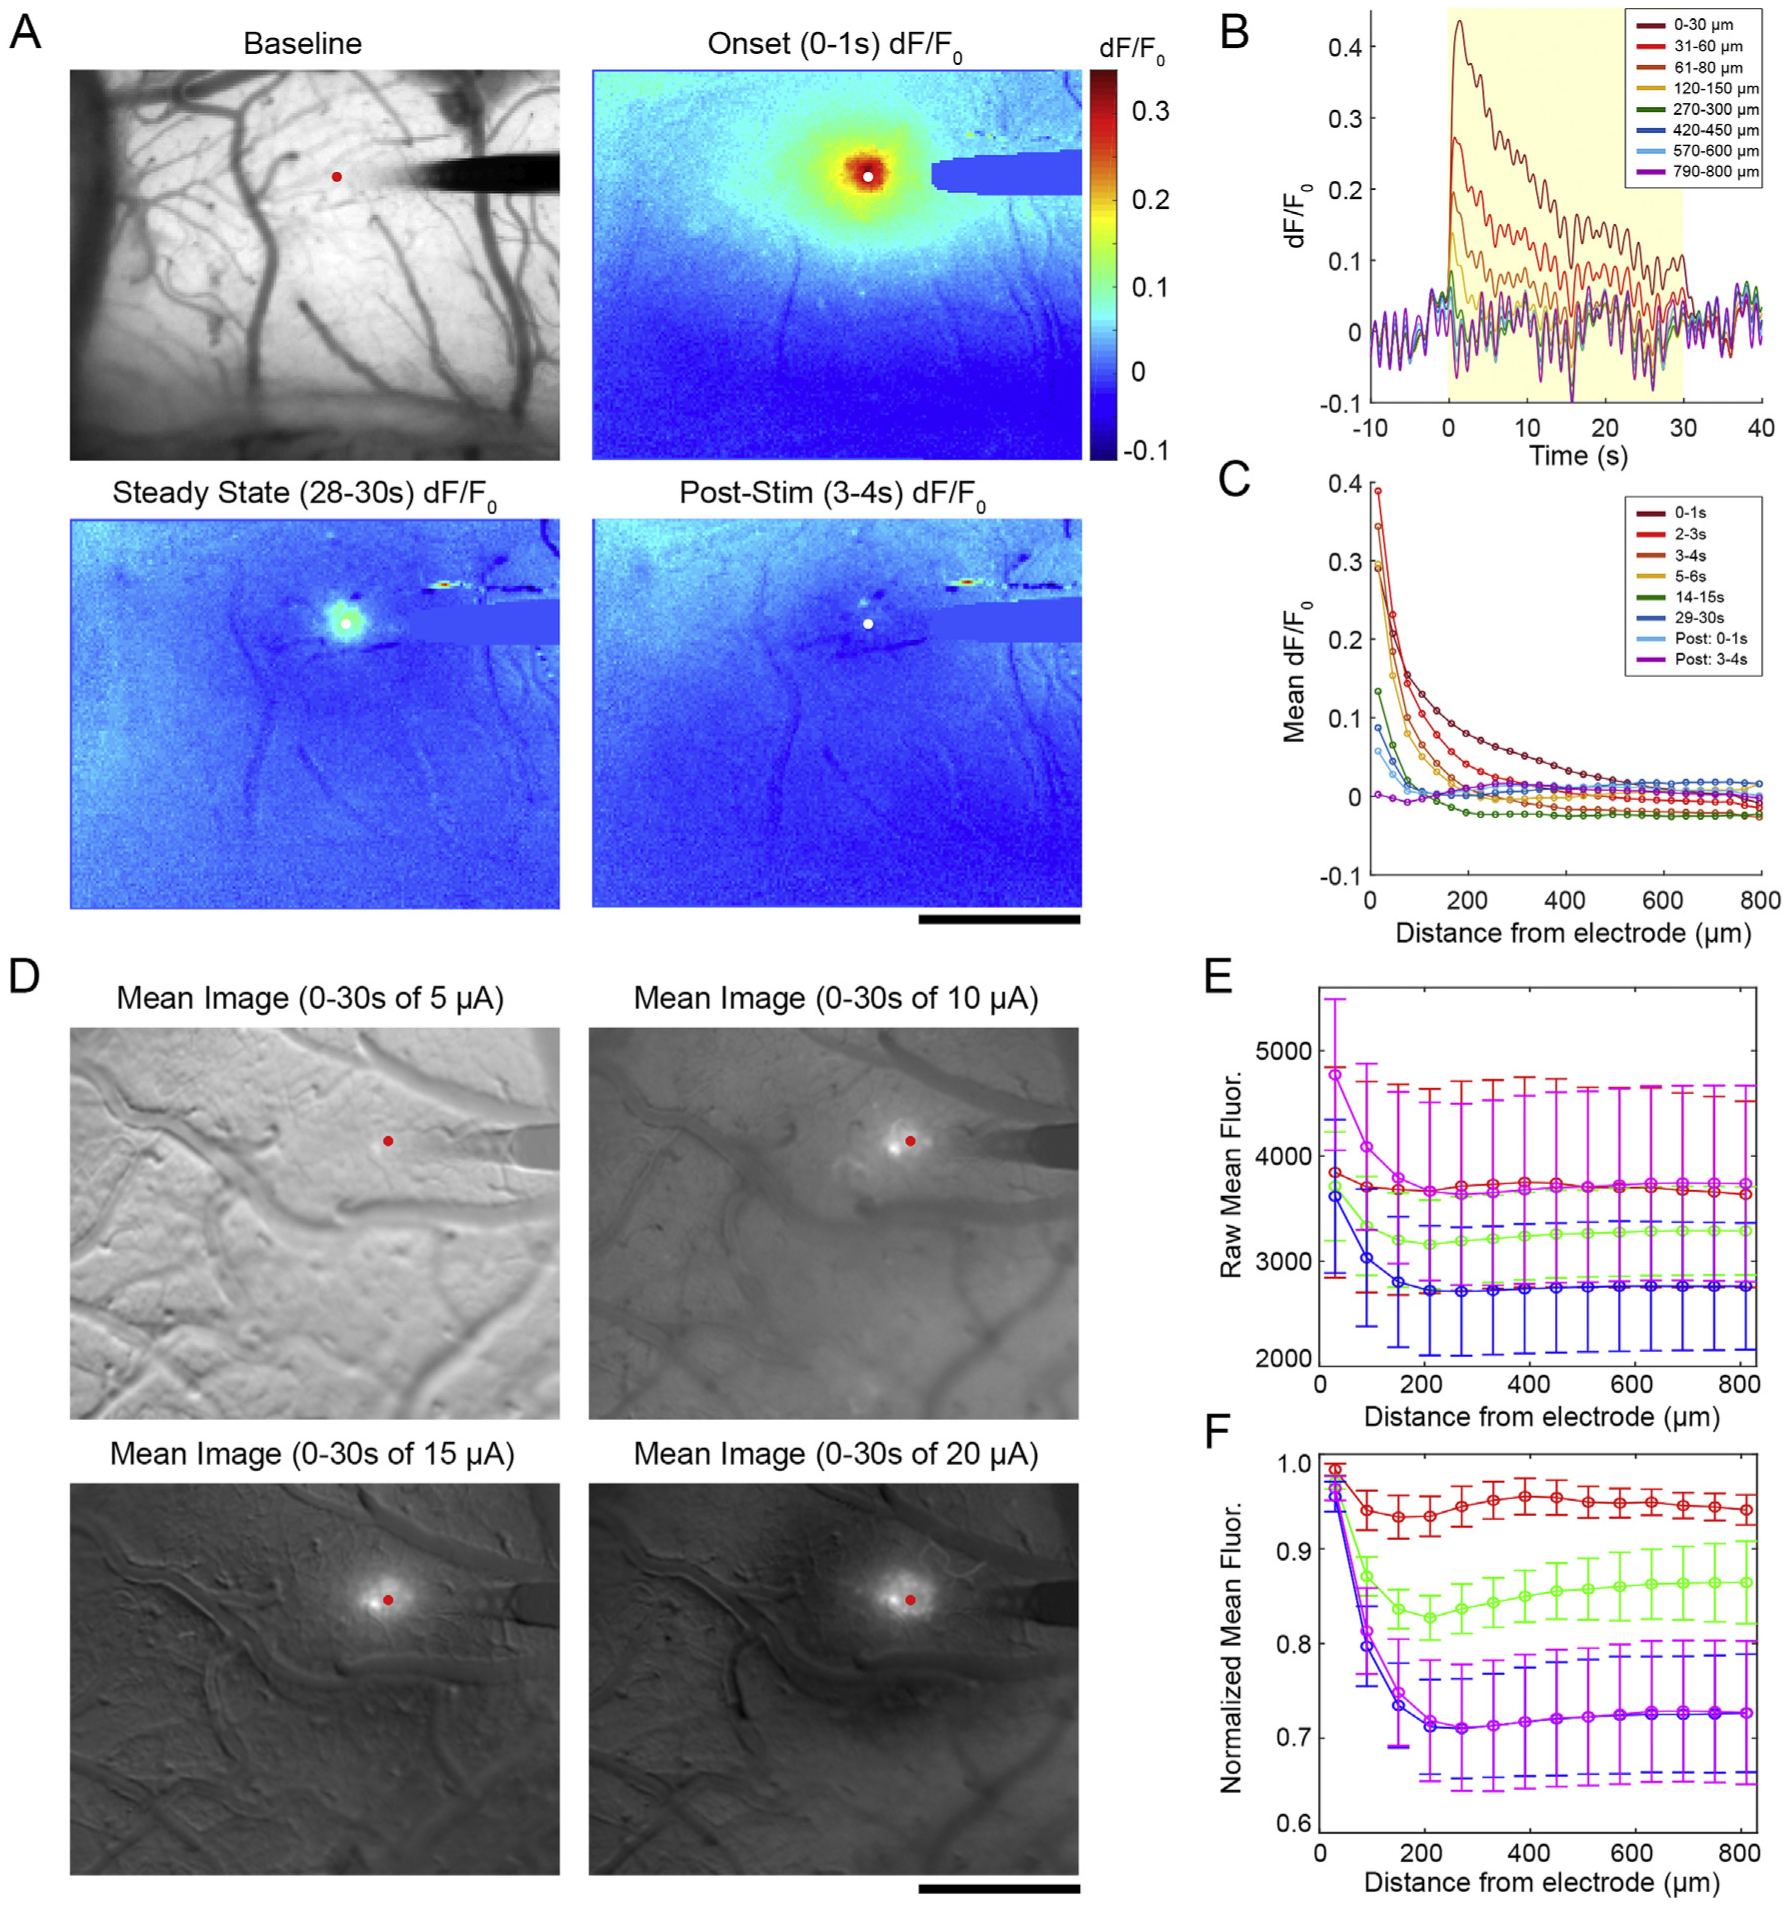
Mesoscale imaging of the Layer II/III neuronal response to ICMS. A) Representative fluorescence and dF/F0 images before, during, and after a 15 μA stimulation. B) dF/F0 traces over time at different bins radiating from the electrode site. The yellow box indicates the period of stimulation on. C) The Mean dF/F0 across all bins at several time points. D) After baseline subtraction, the average fluorescence over the 30s stimulation window was taken. E) Raw fluorescence was measured in 60 μm bins around the electrode with very high error due to high fluctuations in the baseline state of the animals. F) High variability was partly accounted for by normalizing fluorescence to the first bin for each stimulation trial. Significant group effects for distance and amplitude were detected by two-way ANOVA (n = 4, p < 0.0001) with no significant post-hoc tests. Data shown as mean ± SEM. All scale bars are 500 μm.