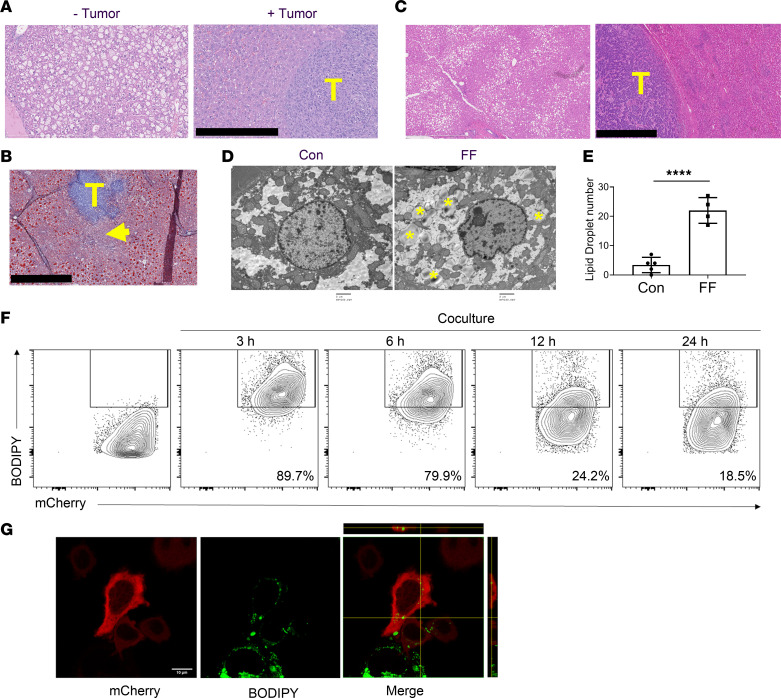
Figure 3. Steatotic hepatocytes transfer lipids to tumor.
(A) H&E staining of FF steatotic liver before (- tumor) and 12 days after Bo1 intracardiac injection (+ tumor). Note the disappearance of steatosis juxtaposed to tumor. Scale bar: 400 μm. T, tumor. (B) Oil red O staining of FF liver 8 days after intracardiac injection of Bo1 cells. Arrow indicates disappearance of lipid staining in hepatocytes juxtaposed to tumor. Scale bar: 1 mm. (C) H&E staining of liver of an NAFLD patient with breast cancer metastasis demonstrating areas distal (left panel) and proximal (right panel) to tumor. Scale bar: 1 mm. (D) Ultrastructural image of Bo1 cells in the liver of control or FF mice 10 days after intracardiac injection. Yellow asterisks indicate lipid droplets. Scale bar: 2 μm. (E) The number of lipid droplets inside a single Bo1 cell in the liver of control and FF mice 10 days after intracardiac injection. n = 4–5. (F) Flow cytometric analysis of frequency of mCherry-labeled Bo1- cells containing BODIPY derived from HepG2 cells after 0, 3, 6, 12, or 24 hours of coculture. n = 3. (G) Confocal Z-stack imaging of mCherry-labeled Bo1– cell after 3 hours of coculture with BODIPY-treated HepG2 cells. Ten sections of a confocal Z-stack were obtained through the height of the cell. The optical section in the middle of cell is presented. The side image on the merged panel is the cross section, and the top image is the longitudinal section of the Bo1– cell present in the middle. The image identifies fluorescence-labeled BODIPY within the tumor cell. Scale bar: 10 μm. Data are presented as mean ± SD. ****P < 0.0001 as determined by unpaired 2-tailed t test (E).

