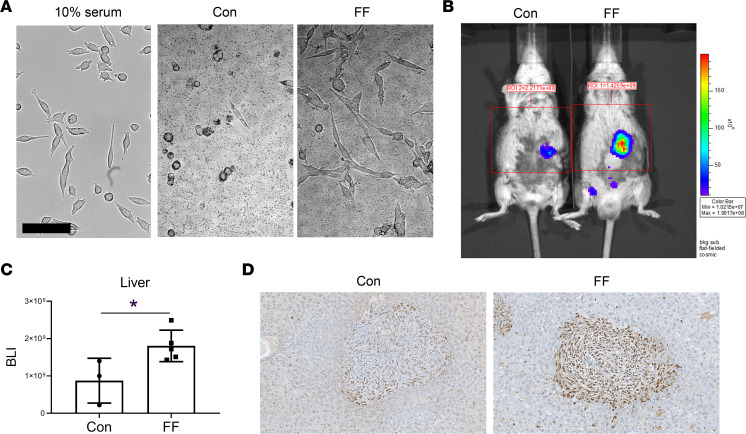
Figure 5. Steatosis promotes tumor growth.
(A) Morphology of Bo1 cells cultured with Con or steatotic liver of FF mice in serum-free medium; left panel shows the normal Bo1 cells cultured with medium with 10% serum. Scale bar: 100 μm. (B and C) Bo1 cells were injected directly into livers of 2-month-old FF and control mice. Tumor burden was analyzed 8 days later: (B) in vivo BLI image and (C) quantification of tumor burden in liver. n = 3–5. (D) PCNA immunostaining of liver of control or FF mice 12 days after intracardiac injection of Bo1 cells. n = 3. Data are presented as mean ± SD. *P < 0.05, as determined by unpaired 2-tailed t test (C).

