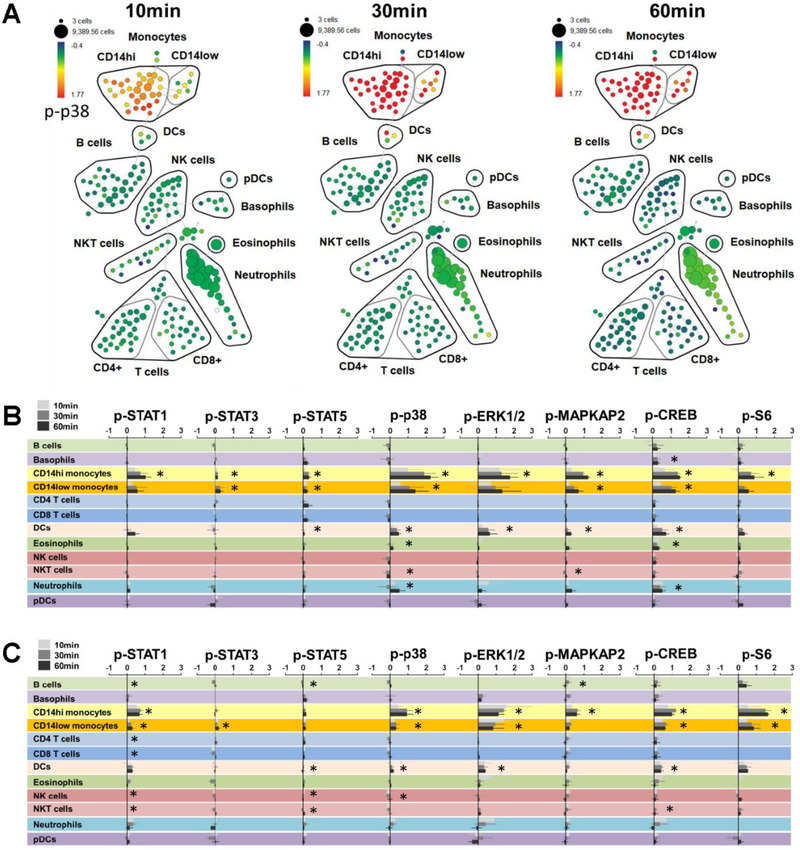
Figure 4. Analysis of phospho-protein activation.
(A) SPADE map of a representative set of SCD patient samples visualizing fold change expression of p-p38 in post-chamber samples relative to time-matched samples that did not pass through the chamber (average p-p38 fold change for CD14hi monocytes = 1.35 (95% CI 0.91 – 1.80, p < 0.0001). Summarized median fold change for all measured phospho proteins across all immune subsets over time for SCD patients (B) and healthy controls (C). Asterisks indicate statistically significant differences in expression of each phospho-protein within each cell population between pre- and post-chamber samples after adjustment for multiple comparisons using the Holm procedure. Hypotheses were tested using a multivariable general estimating equation for each surface protein. Each regression included adjustment for time and cell type, with clustering of standard errors around each individual.

