Figure 4.

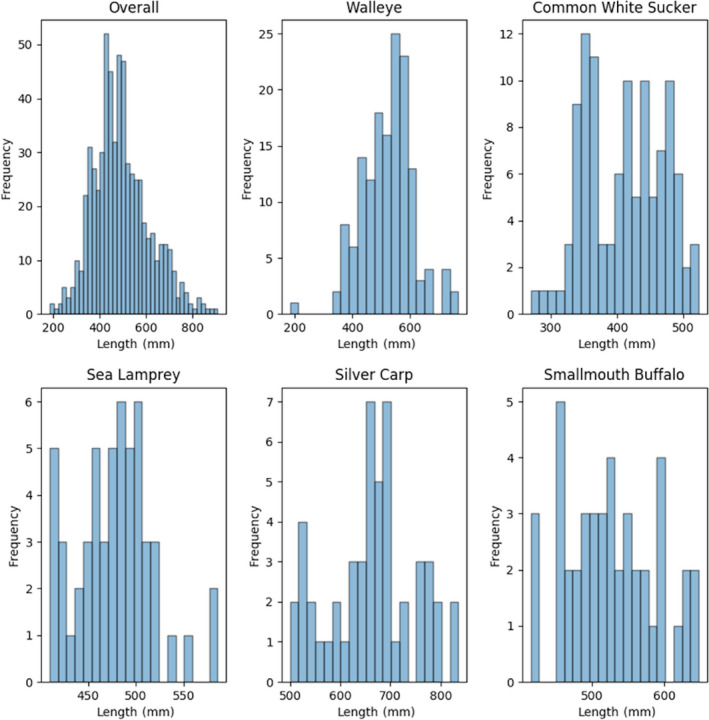
Histograms: Frequency of distribution of fish lengths in the overall training dataset and the top five most abundant species by image count

Histograms: Frequency of distribution of fish lengths in the overall training dataset and the top five most abundant species by image count