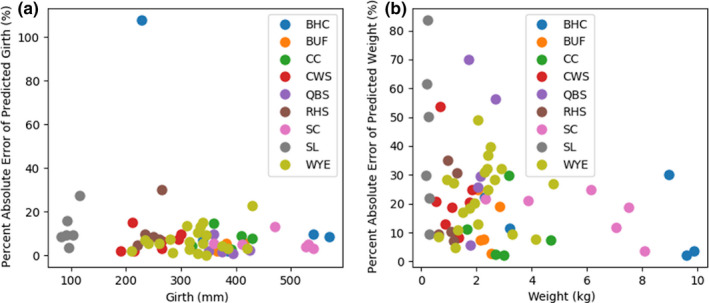
Figure 12.

Absolute percent error of multi‐target ensemble predictions for girth (a) and predicted weight (b) on the test dataset. The predictions for species with 5 or more samples in the test dataset are plotted against the measured girth and weight, respectively
