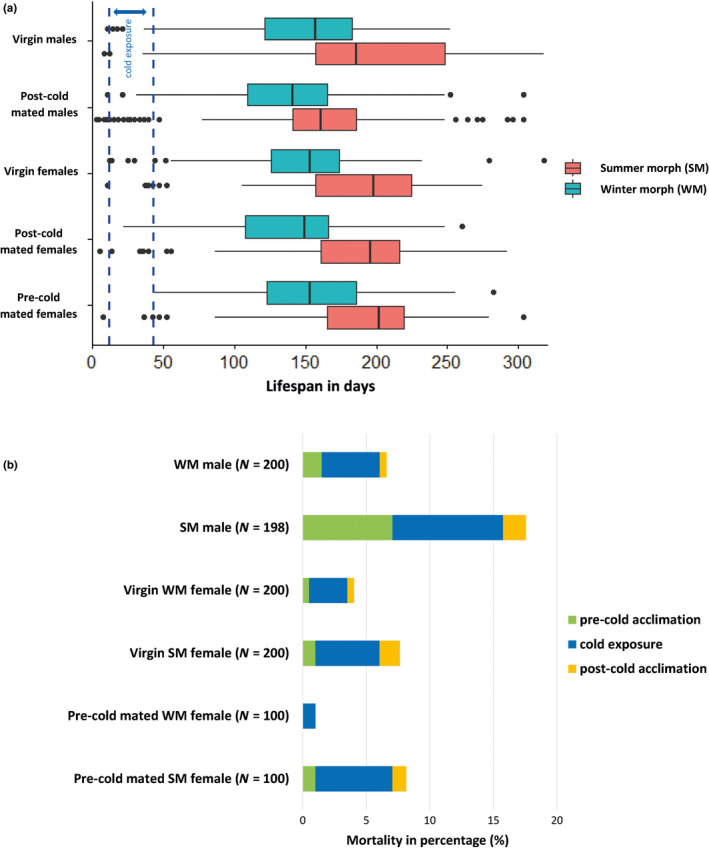
FIGURE 2.

Lifespan and mortality of D. suzukii experimental groups (see Table 1). (a) Boxplots representing the lifespan of the flies (N = 100 flies per experimental group upon emergence). The flies were monitored throughout the experiment, from emergence (day 0) until death. The cold‐exposure period (31 days in total from day 12 until day 43) is delimited by the blue dashed lines. Each box represents the interquartile range of lifespan for the experimental group, the line in the middle is the median, the whiskers represent extreme values within 1.5 times the interquartile range, and the dots are the “outliers.’’ (b) Barplots representing the mortality of the flies during the acclimation and cold‐exposure periods. The percentage of flies dying (of those alive at the start of each period) during the 8‐day precold acclimation period, the 31‐day cold‐exposure period, and the 4‐day postcold acclimation period is shown for each group of flies. The number of living flies upon the first day of acclimation is indicated by the letter N
