
Figure 2.
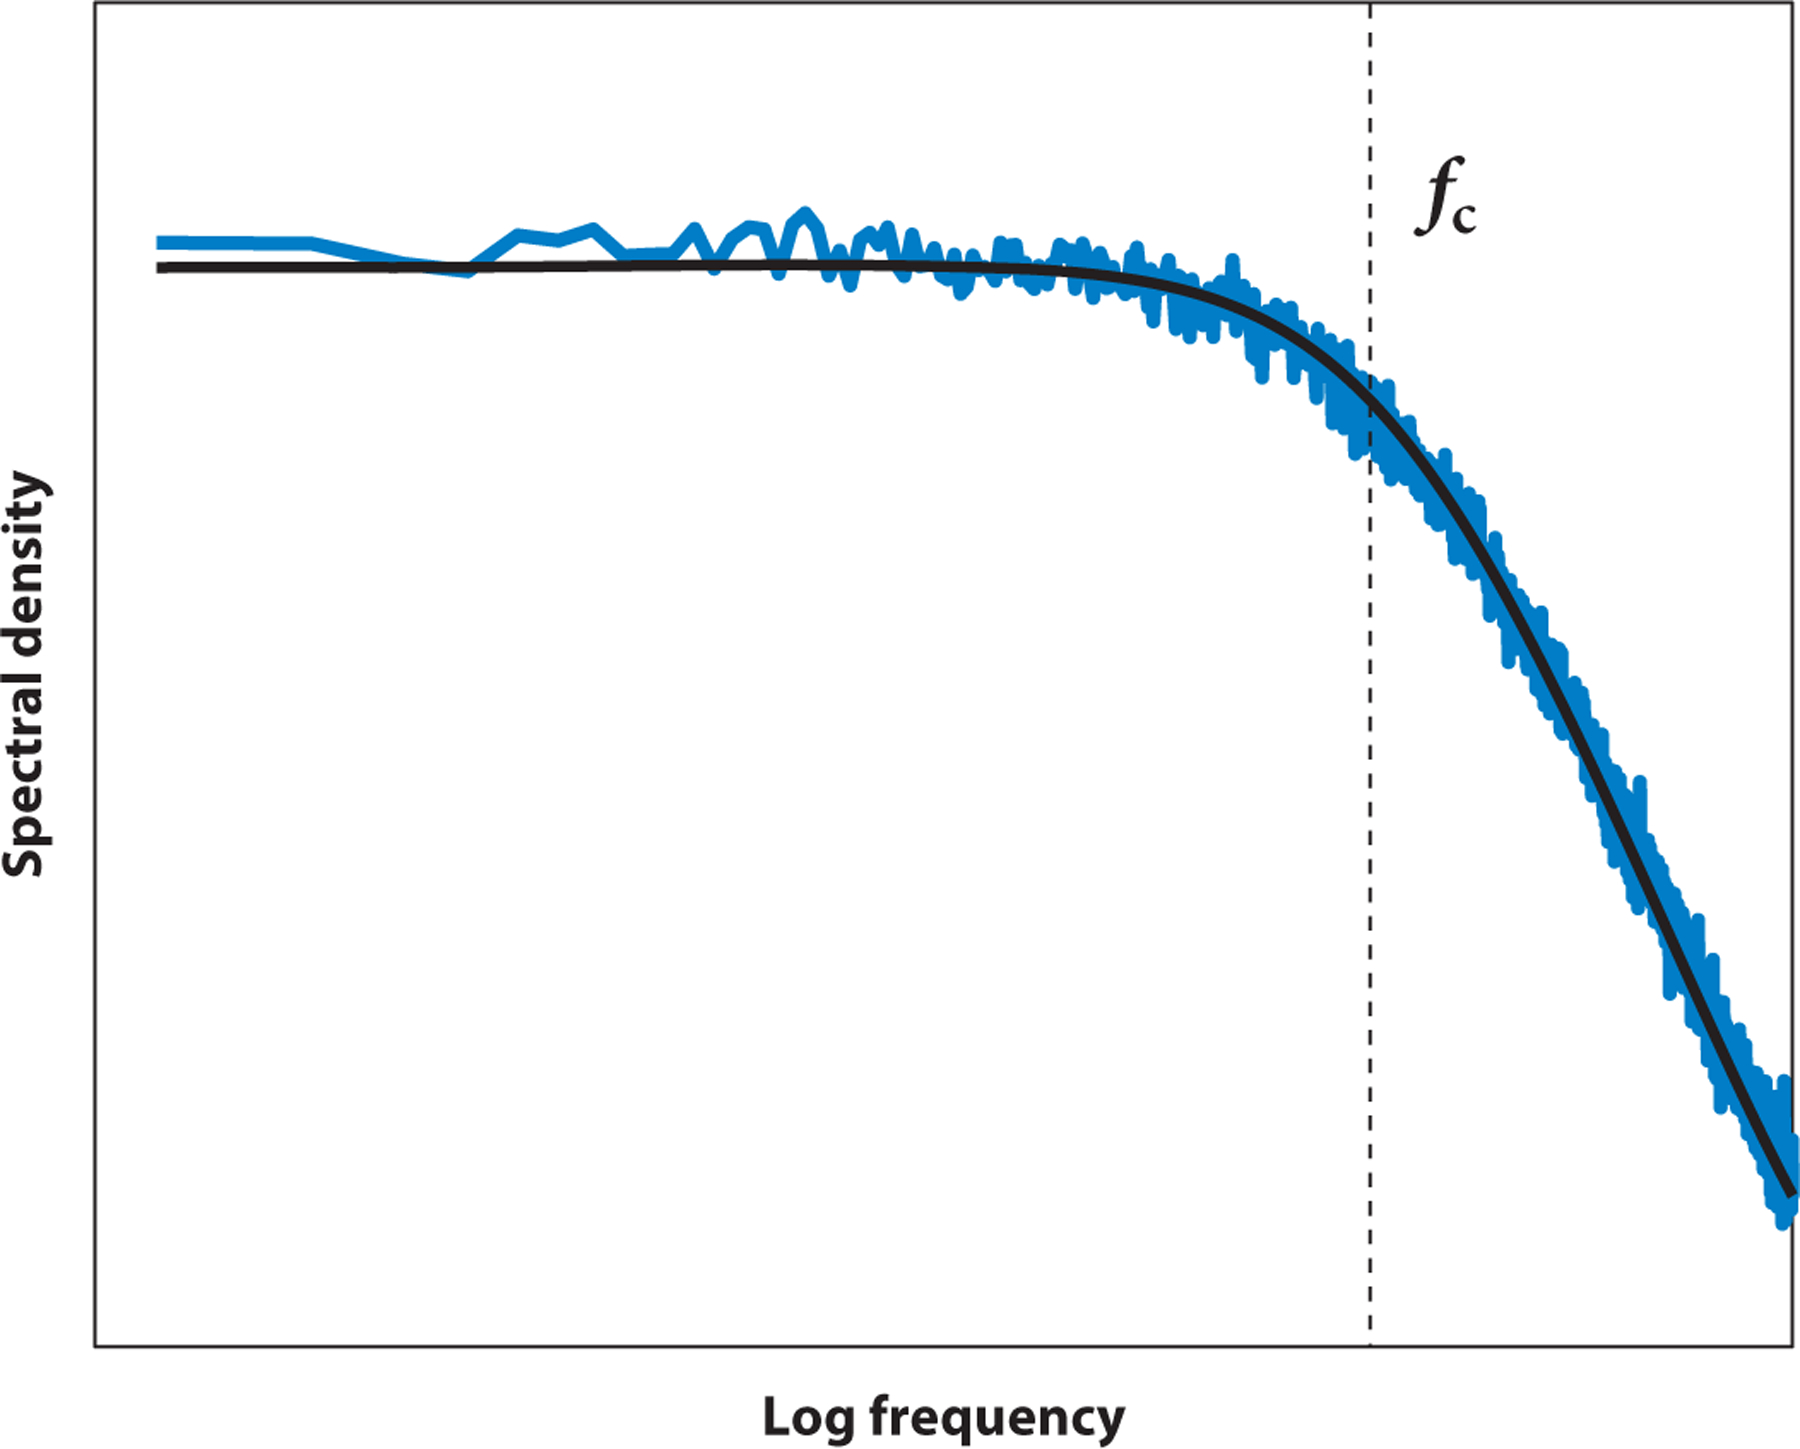
Example of a typical power spectrum of an optically trapped bead. A power spectrum of the fluctuations of an optically trapped bead is shown in blue, and the fit to a Lorentzian function is shown in black. At frequencies below the characteristic corner frequency fc, the spectrum is almost constant. At higher frequencies, it decreases as 1/f 2.