
Figure 5.
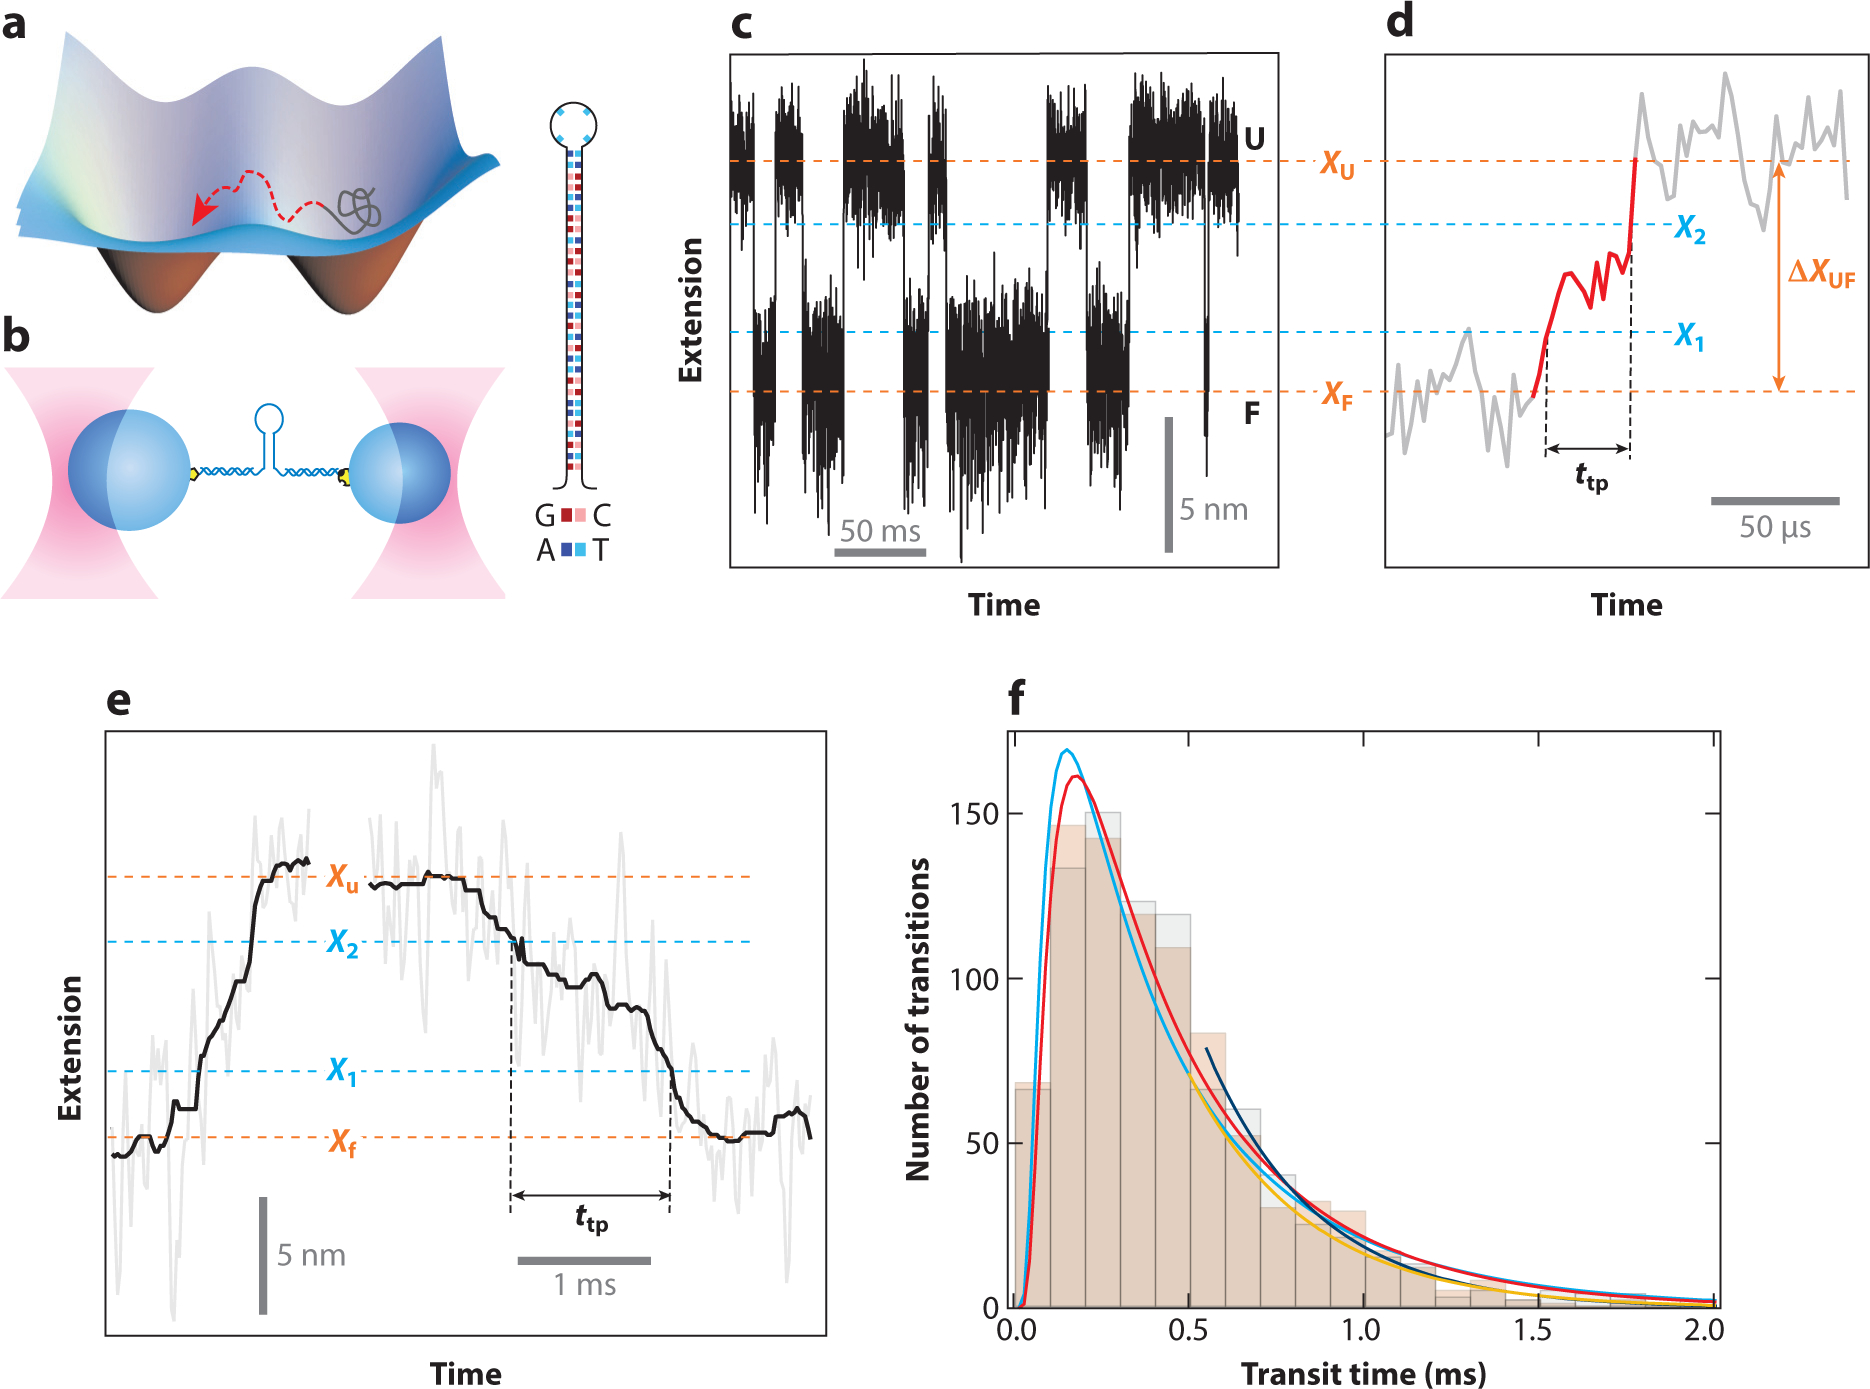
Characterizing transition paths using optical tweezers. (a) The transition state is the least-occupied state in a folding free energy landscape due to its high energy. As such, characterization through the use of traditional biophysical measurements has been impossible. (b) Highly stable dual-trap optical tweezers instruments are well suited to study transition states and transition paths. Initial studies following the folding of DNA hairpins showed that it was possible to directly observe transition states. (c) The hairpin hops between the folded (F) and unfolded (U) states in constant-force equilibrium experiments. (d) Magnified view of an unfolding transition, identified as the part between the folded and unfolded states. These experiments permit the measurement of the transition path time, ttp. (e) Example of a ttp measurement for the prion protein PrP. (f) The ttp distributions are very similar for PrP unfolding (black bars) and folding (beige bars) and are well described by a model based on Kramer’s theory (the cyan curve is for folding, and the red curve is for unfolding). The exponential tails are fit well by a separate equation (the blue curve is for folding and the orange curve is for unfolding). Figure adapted with permission from Neupane et al. (66).