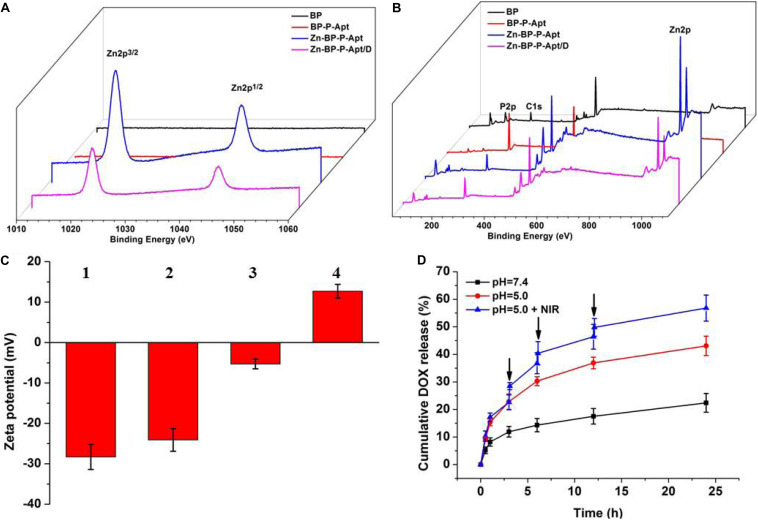
FIGURE 2.
XPS spectra of BP, BP-P-Apt, Zn-BP-P-Apt and Zn-BP-P-Apt/D. (A) Narrow scan for Zn2p peaks (B) Survey of all tested peaks. Zeta potentials of BP-based NPs. (C) Zeta potentials of BP-based NPs. 1, 2, 3, and 4 represent BP, BP-P-Apt, Zn-BP-P-Apt, and Zn-BP-P-Apt/D, respectively. (D) Drug release profiles of Zn-BP-P-Apt/D at pH 7.4 and pH 5.0 with or without NIR irradiation, ↓: NIR irradiation for 10min.

