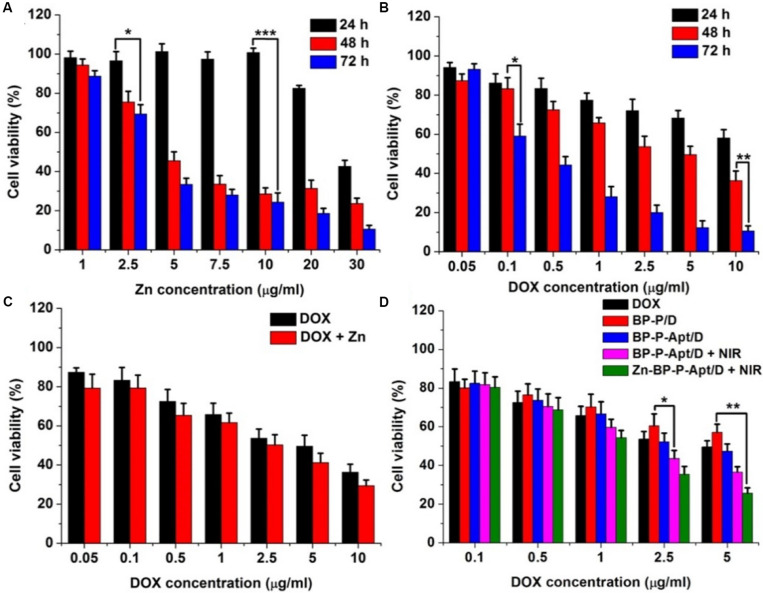
FIGURE 6.
(A) Relative cell viability of PC3 cells after incubation with different concentrations of Zn2+ for 24, 48, and 72 h. (B) Cell viability of PC3 cells after incubation with DOX at different concentrations for 24, 48, and 72 h. (C) Cell viability of PC3 cells treated with DOX or DOX + Zn2+ (Zn2+ concentration was 1 μg mL–1) at various concentrations of DOX for 48 h. (D) Cell viability of PC3 cells treated with different samples with or without NIR laser irradiation at various concentrations of DOX for 48 h. (*p < 0.05, **p < 0.01, ***p < 0.001).

