FIGURE 5.
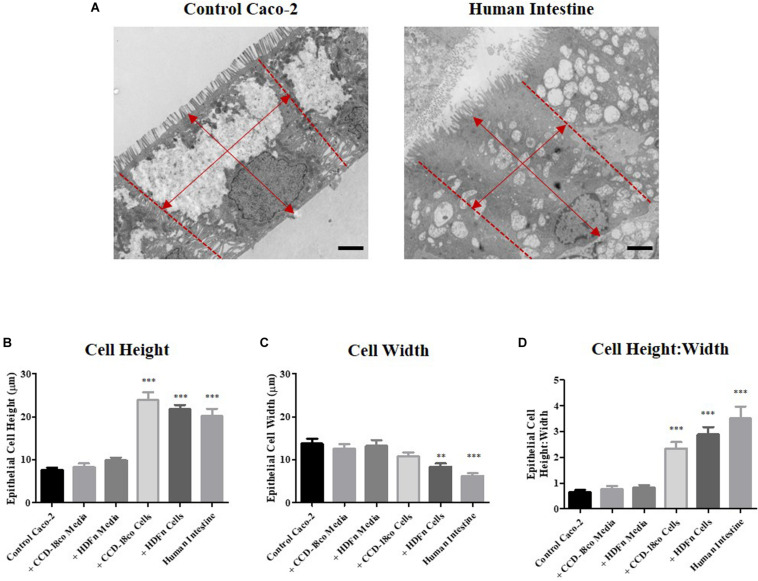
Morphometric analysis of epithelial cells in in vitro models and intestinal tissue. (A) Example TEM micrographs of Caco-2 Transwell® control models and human tissue which were used to measure epithelial (B) cell height and (C) width [as indicated by arrows (A)], and (D) calculation of the ratio of epithelial cell height:width. Scale bars: 2 μm, n = 15 for in vitro models, n = 10 for human tissue, ∗∗P < 0.001, ∗∗∗P < 0.0001 compared to control Caco-2 monolayers.

