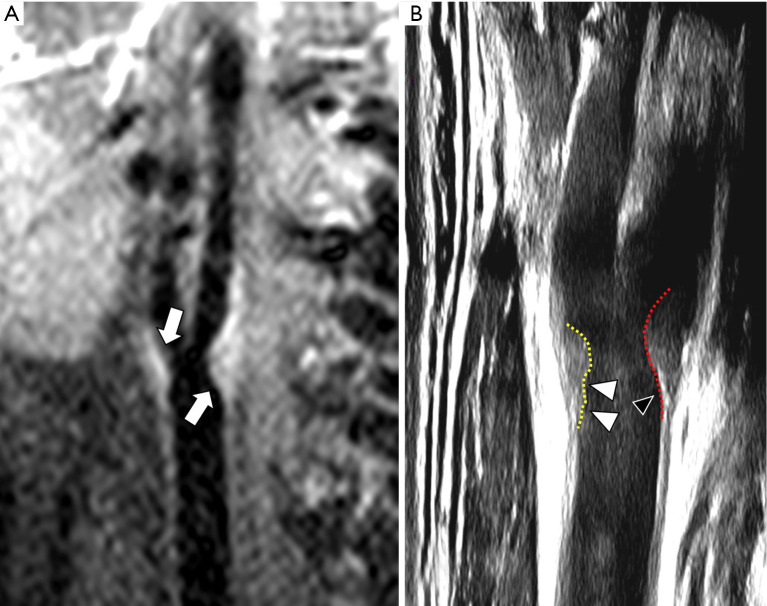
Figure 3.
The same patient of Figure 1 was studied on a 3 Tesla MR with a T1-weighted fat-suppressed sequence and with US. (A) The plaque is clearly visible and it results slightly inhomogeneously hyperintense when compared to the adjacent tissues on T1-weighted fat-suppressed sequence due to the high-lipid component. (B) The US of the same vessel evidence that the border of the plaque adjacent to the internal carotid artery (red dashed line) is regular and with a the FC hyperechoic in the lower part as for the presence of calcifications (black arrowhead); the portion of the cap next to the external carotid artery (yellow dashed line) is irregular as for the presence of small defects <1 mm. US, ultrasound; FC, fibrous cap.

