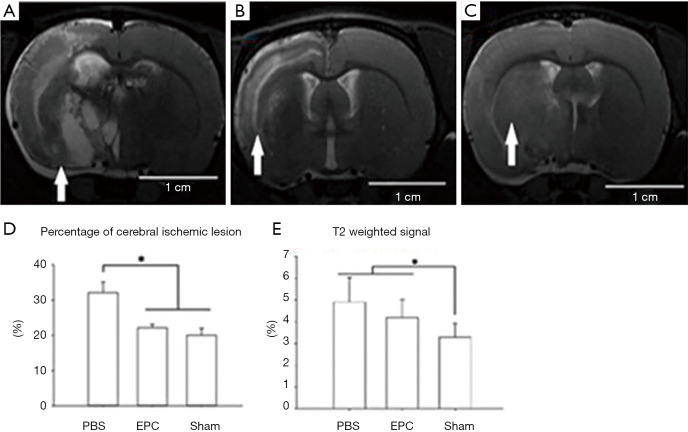
Figure 3.
MRI of MCAO groups on postoperative day 14. (A,B,C) Brain MRI findings evaluated ischemic lesion volumes and gliosis status: (A) PBS group; (B) EPC group; (C) sham group. The arrow represents the ischemic volume in the corresponding cerebral areas. (D,E) Ischemic volume analysis: (D) cerebral cortex T1W signal analysis. The results showed that the volume was higher in the PBS group than in the EPC and sham groups (*, P<0.05); (E) cerebral cortex T2W signal analysis yielded the same results as the T1W (*, P<0.05). MRI, magnetic resonance imaging; MCAO, middle cerebral artery occlusion; EPC, endothelial progenitor cell; PBS, phosphate buffered saline.

