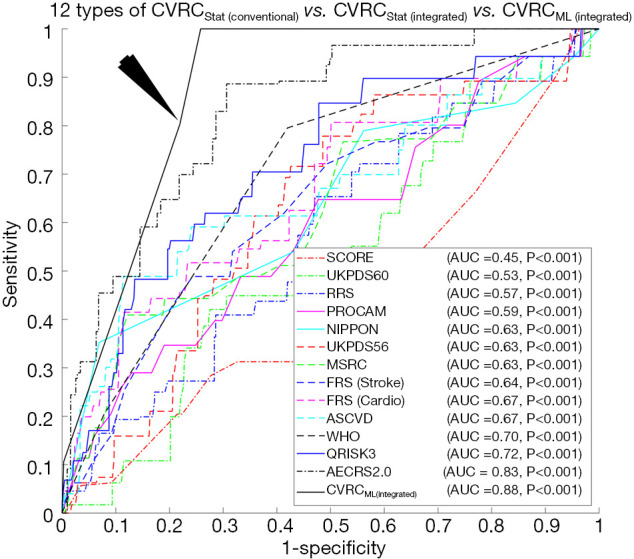
Figure 6.

Incremental risk stratification performance from (I) CVRCStat(Conventional), (II) CVRCStat(Integrated) to CVRCML(Integrated), showing an improvement by ~42% between conventional statistical calculators and SVM-based calculator with integrated risk factors. The black arrow indicates the ROC curve of the SVM-based ML calculator with integrated risk factors.
