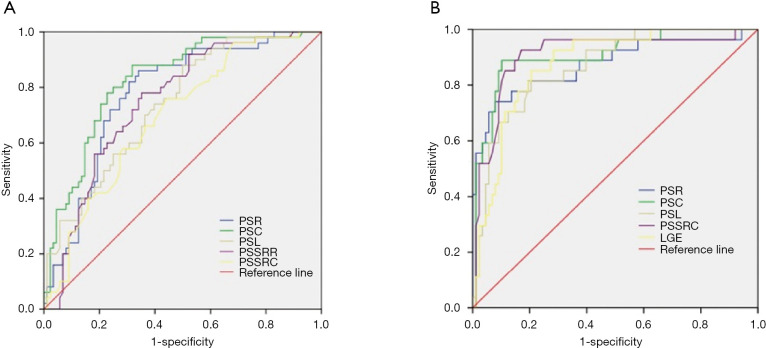
Figure 5.
Receiver operating characteristic curves analysis showed PSC (AUC =0.83) did the best diagnostic performance for the differentiation of EF preserved myocarditis and control (A), PSC, PSSRC (AUC =0.91) did the best diagnostic performance for the differentiation of EF reduced myocarditis patients and EF preserved myocarditis patients (B). PSC, peak strain circumferential; PSSRC, peak systolic strain rate circumferential.

