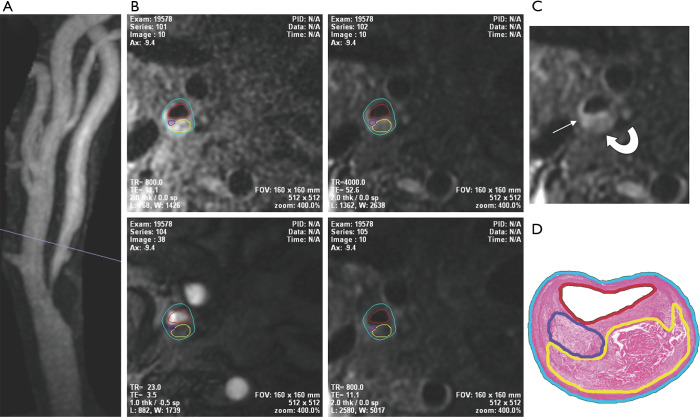
Figure 1.
Comparison of high-resolution MR angiography, multicontrast 3 Tesla in vivo carotid plaque MR imaging, and ex vivo histologic evaluation of a carotid endarterectomy specimen. (A) There is 82% carotid stenosis on the high-resolution carotid CE MRA; (B) these examples of T1W, T2W, TOF, and CE-T1W plaque images obtained at the level of the carotid artery stenosis (A) show how the 3-T in vivo carotid plaque MR imaging identifies the LRNC (yellow outline) and loose matrix (purple outline) through the right carotid artery plaque; (C) the region of the LRNC is dark (curved arrow) on these T2W images, whereas the areas of loose matrix (arrow) is bright; (D) the percentage areas of plaque that were characterized as LRNC (yellow outline) and loose matrix (blue outline) on the histologic slide is similar to that measured on the in vivo 3-T MR images. CE MRA, contrast-enhanced MR angiography; T1W, T1 weighted image; T2W, T2 weighted image; TOF, time-of-flight MR angiography; CE-T1W, contrast-enhanced T1 weighted image; LRNC, lipid-rich necrotic core. (From DeMarco JK, Huston J 3rd. Imaging of high-risk carotid artery plaques: current status and future directions. Neurosurg Focus 2014;36:E1 with permission.)

