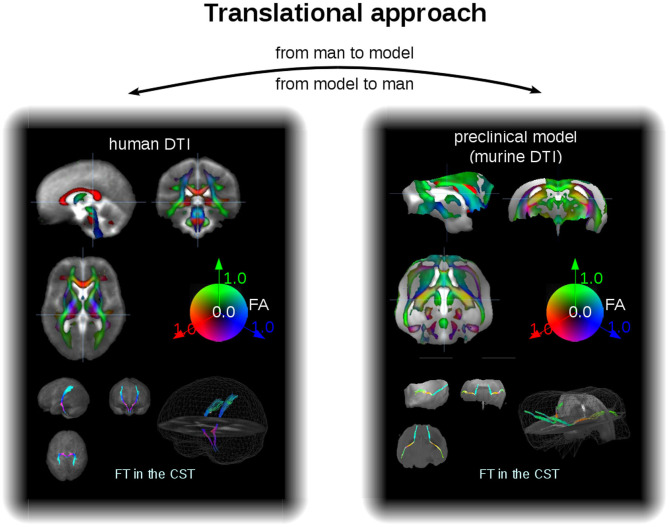
Figure 3.
Translational approach. In a different scale, DTI data of man and mice can be analyzed within the same software environment, that is, with the same analysis cascade. Examples for FA maps in coronar, sagittal, and axial orientation (upper panel) and projectional views of FT examples (lower panel) for human (left) and murine (right) group averaged data sets. The cerebellum of the mouse brains has been masked out. CST, corticospinal tracts.

