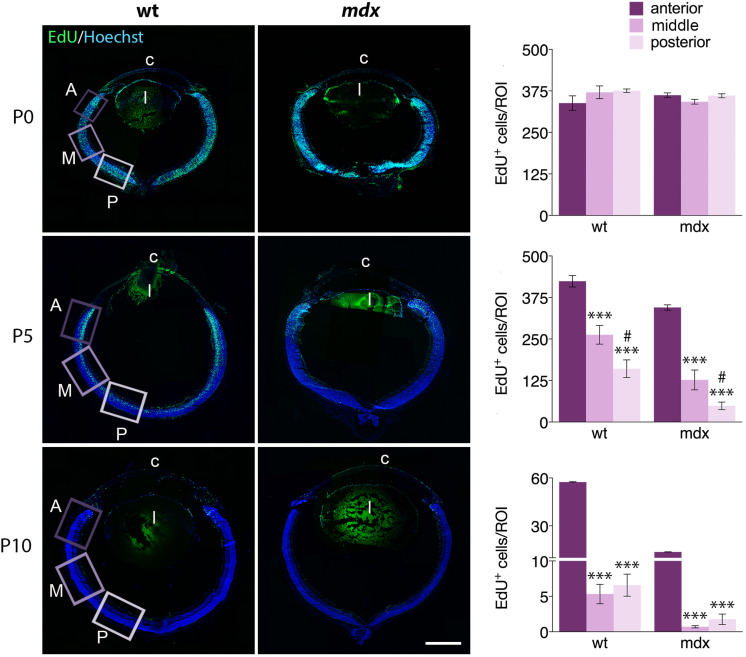
FIGURE 9.
The pattern of distribution of EdU+ proliferative cells along the retinal perimeter does not differ between wild type and mdx mice. On the left side of the figure, representative images of EdU+ cell (green) distribution along the entire perimeter of horizontal (N–T) retina cryosections of P0, P5, and P10 wild type (wt) and mdx mice. Nuclei are stained in blue (Hoechst); c: cornea; l: lens. On the right side, comparative quantitative analysis of the number of EdU+ proliferating cells/region of interest (ROI), distinct by regions: anterior, middle and posterior retina. Data are analyzed by one-way ANOVA test Tukey post hoc and represented as the mean ± SEM. ∗∗∗p ≤ 0.001 (vs. anterior region); #p ≤ 0.05 (vs. middle region). n = 3–6 independent experiments. Scale bar: 200 μm.

