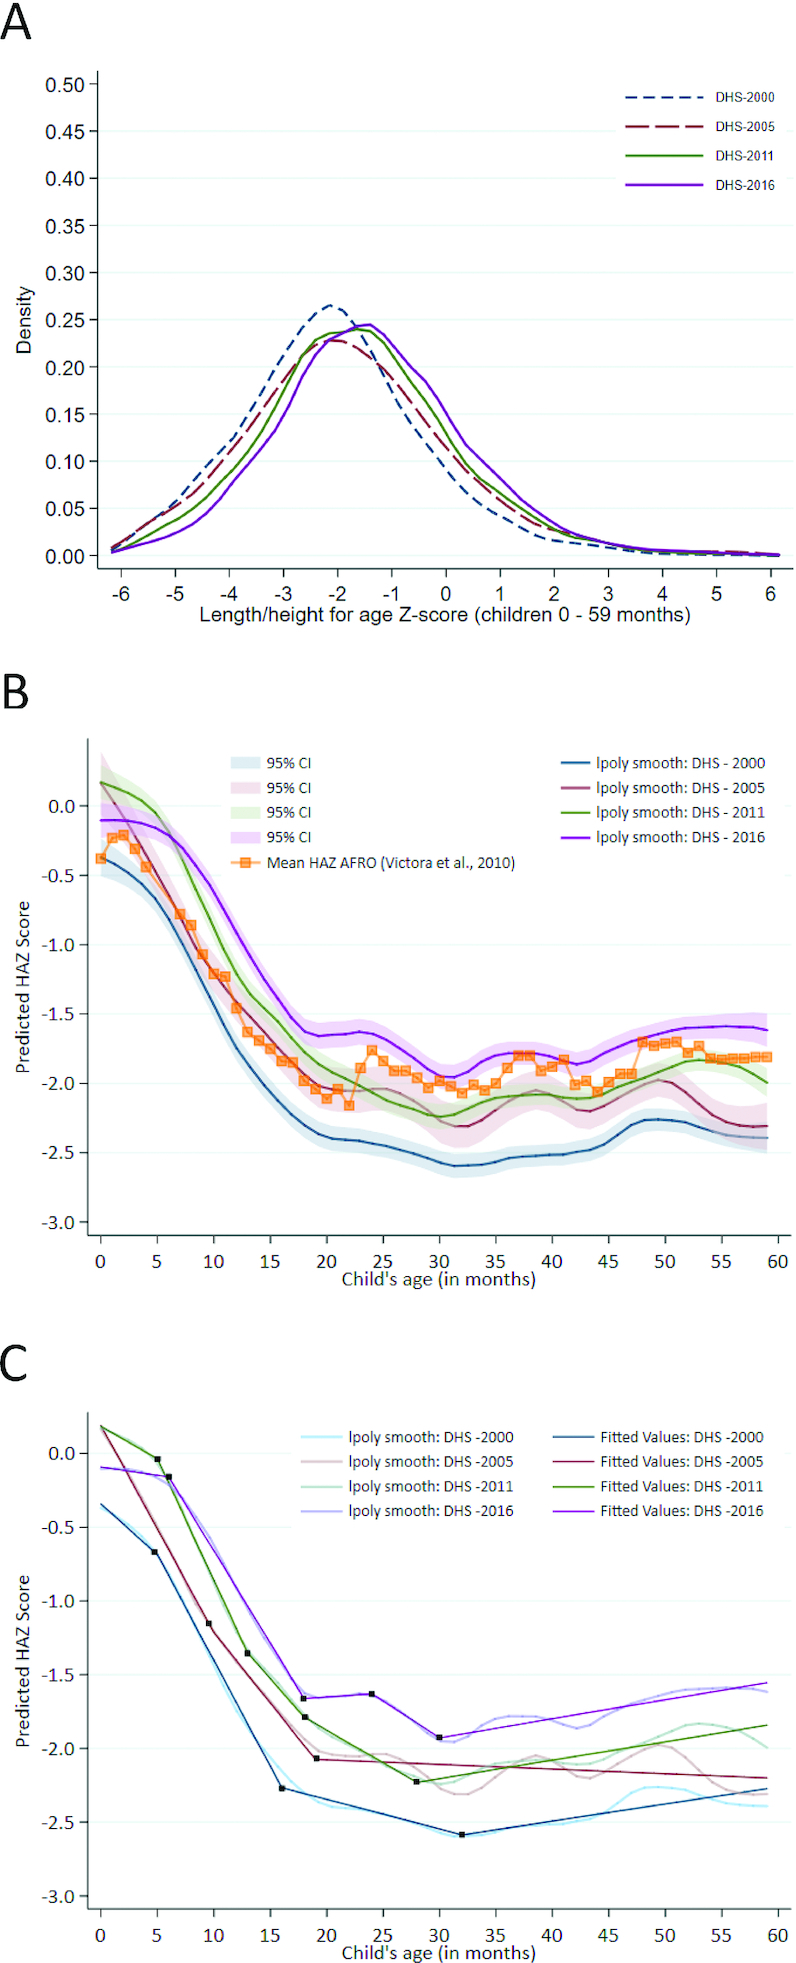
FIGURE 3.

Distribution of HAZ scores and growth faltering among children under 5 y old. (A) Kernel density plot for HAZ distribution in children <5 y, DHS 2000, 2005, 2011, and 2016. (B) Victora curve using data from the 2000, 2005, 2011, and 2016 surveys among children <5 y, with 95% CIs (145). (C) Victora curve using data from the 2000, 2005, 2011, and 2016 surveys among children <5 y, with linear splines. DHS, Demographic and Health Survey; HAZ, height-for-age z score.
