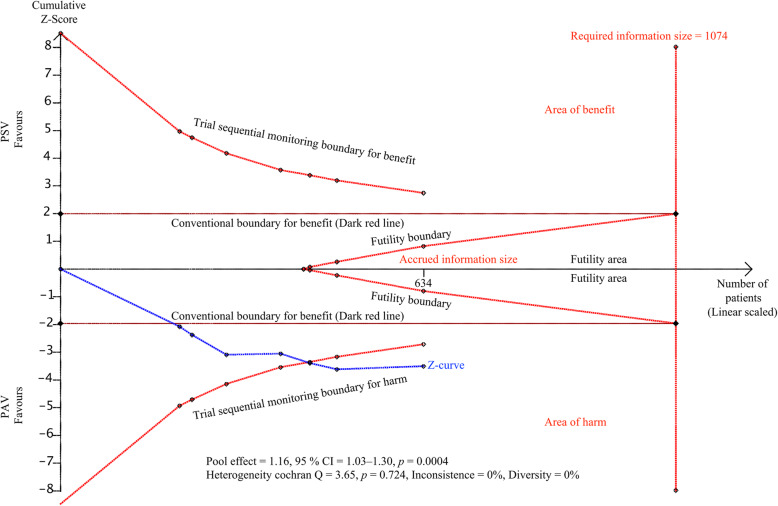
Fig. 3.
Trial sequential analysis of weaning success. The x-axis represents the accrued versus required information size of patients. The y-axis represents the z values, representing the accumulating statistical information. The blue line (z-curve) represents the cumulative Z value, and each square represents an individual trial. The small red lines at the top and bottom left-hand corners, trial sequential boundaries for benefit or harm, represent the threshold for statistical significance in TSA. The horizontal dark red lines represent the threshold for significance in conventional meta-analysis, at 1.96 of the Z value, corresponding to 0.05 of the P value. The red line in a triangle shape represents the futility boundaries and futility area in TSA. In this figure, TSA of the primary outcome, weaning success, showed that the Z-curve has not yet reached the required information size, but crosses the conventional boundary and the trial sequential monitoring boundary curve for benefit with statistical significance, suggesting conclusive and robust results in favor of PAV

