Fig. 1.
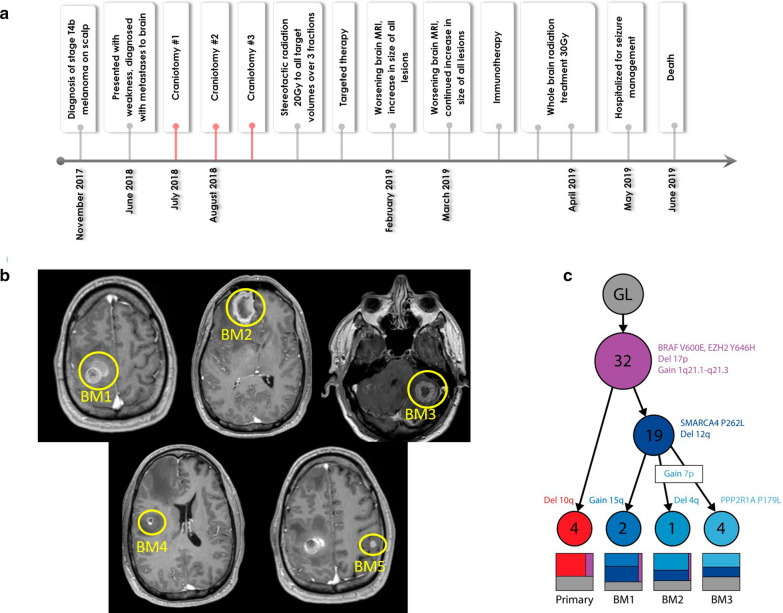
Clinical Course, Radiological Imaging and Phylogeny of Patient with 3 anatomically distinct melanoma brain metastases. a Timeline summarizing clinical course from diagnosis to death. Red lines denote the surgical resections during which tissue samples were obtained for proteogenomics. b Post contrast axial T1 MR images of Brain Metastases (BM) 1, 2, and 3, which were surgically removed. BM 4 and BM 5 were treated with radiation. c Tumor phylogeny shows the accumulated and shared mutations and copy number events gained during evolution from original germline (GL) cells to primary and metastatic tumors. Each node represents a new clonal lineage and is marked with the number of new SNVs observed. The treemaps show the proportion of each clone of which each sample was composed

