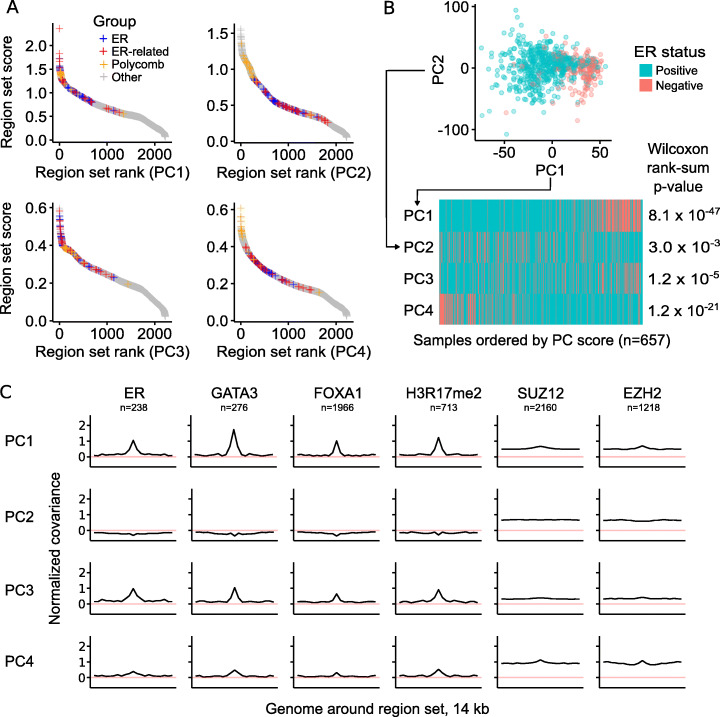
Fig. 2.
COCOA identifies sources of DNA methylation regulatory variation. a The COCOA score for each region set, ordered from highest to lowest. The ER-related group includes GATA3, FOXA1, and H3R17me2. The polycomb group includes EZH2 and SUZ12. b The association of PC scores with ER status for PCs 1–4 based on a Wilcoxon rank-sum test. c Meta-region profiles of several of the highest scoring region sets from PC1 (GATA3, ER, H3R17me2) and two polycomb group proteins (EZH2, SUZ12). Meta-region profiles show covariance between PC scores and the epigenetic signal in regions of the region set, centered on the regions of interest. A peak in the center indicates that DNA methylation in those regions covaries with the PC specifically around the sites of interest. The number of regions from each region set that were covered by the epigenetic data in the COCOA analysis (panel a) is indicated by “n”

