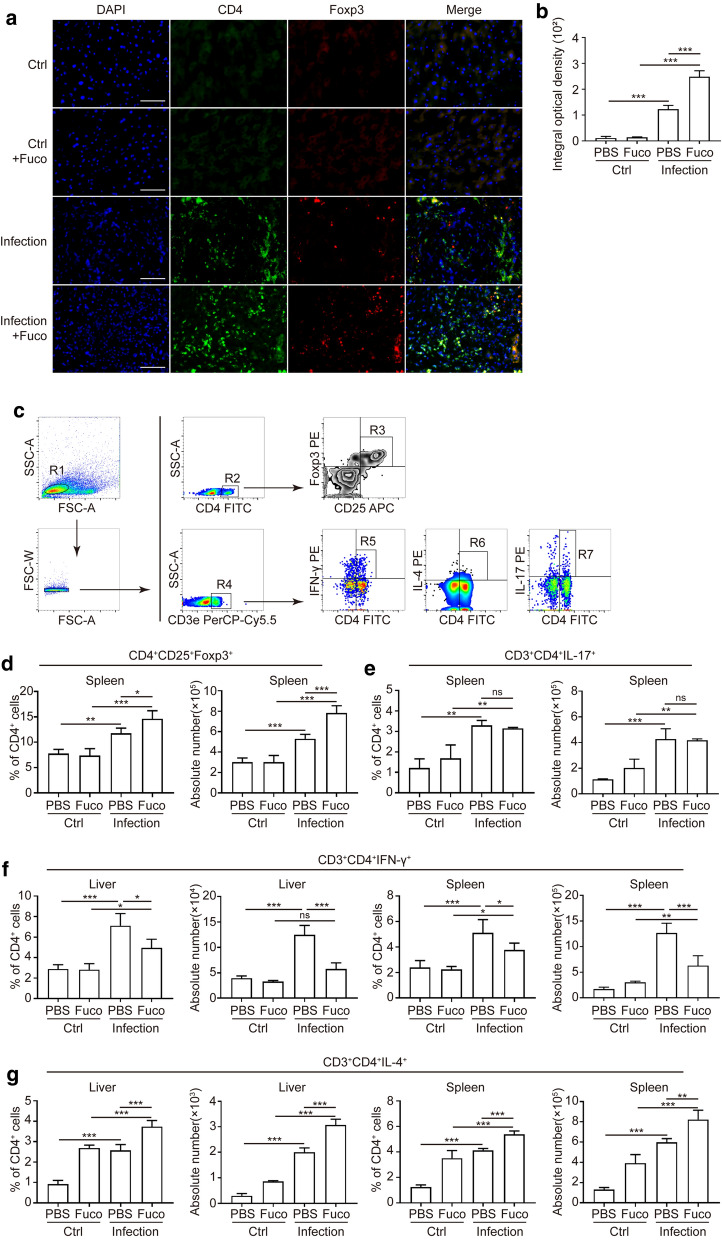
Fig. 4.
Analysis of CD4+ T cell subsets in mice after fucoidan treatment. a Immunofluorescence of CD4 (green) and Foxp3 (red) in the liver granulomas from the normal or S. japonicum-infected mice treated with or without fucoidan. Original magnification: ×400. b The mean optical density of CD4+Foxp3+ cells in each group was digitized and analyzed using Image-Pro Plus software. c Gating strategy for CD3+CD4+Foxp3+ (Treg), CD3+CD4+IL-17+ (Th17), CD3+CD4+IFN-γ+ (Th1) and CD3+CD4+IL-4+ (Th2) cells. Percentages and absolute numbers of Treg (d), Th17 (e), Th1(f) and Th2 (g) cells from hepatic or splenic lymphocytes of each group were analyzed by flow cytometry. Data are expressed as the mean ± SD for each group (n = 5 for each group), and all experiments were performed twice with similar results. *P < 0.05, **P < 0.01, ***P < 0.001. Abbreviation: ns, not significant (ANOVA/LSD). Scale-bars: a, 25 µm

