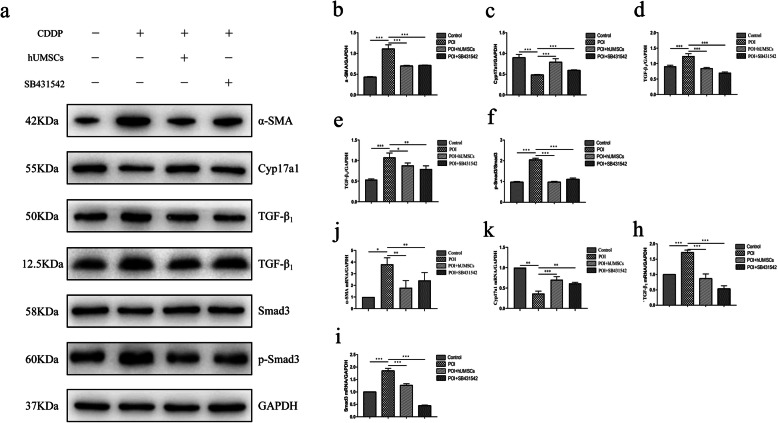
Fig. 6.
Analysis of protein and RNA expression of cell differentiation following the treatment of TGF-β1 inhibitor in cultured stromal cells. a Representative blot of Western blot analysis on each cell differentiation and fibrosis marker in hUMSC medium-cultured stromal cells with and without SB431542 treatment. b–f Quantitation on protein expression of cell differentiation marker α-SMA, Cyp17a1, and TGF-β1/Smad3 signaling pathway in each group. g–i The RNA expression of α-SMA, Cyp17a1, TGF-β1, and Smad3 by qRT-PCR analysis in each group. GAPDH was used as an internal control. Data are expressed as the means ± SD. *P < 0.05, **P < 0.01, and ***P < 0.001. TGF-β1 transforming growth factor-β1, hUMSC human umbilical cord-derived mesenchymal stem cells, α-SMA alpha smooth muscle actin, Cyp17a1 Cytochrome P450 17A1, qRT-PCR quantitative real-time polymerase chain reaction, GAPDH glyceraldehyde-3-phosphate dehydrogenase, and SD standard deviation

