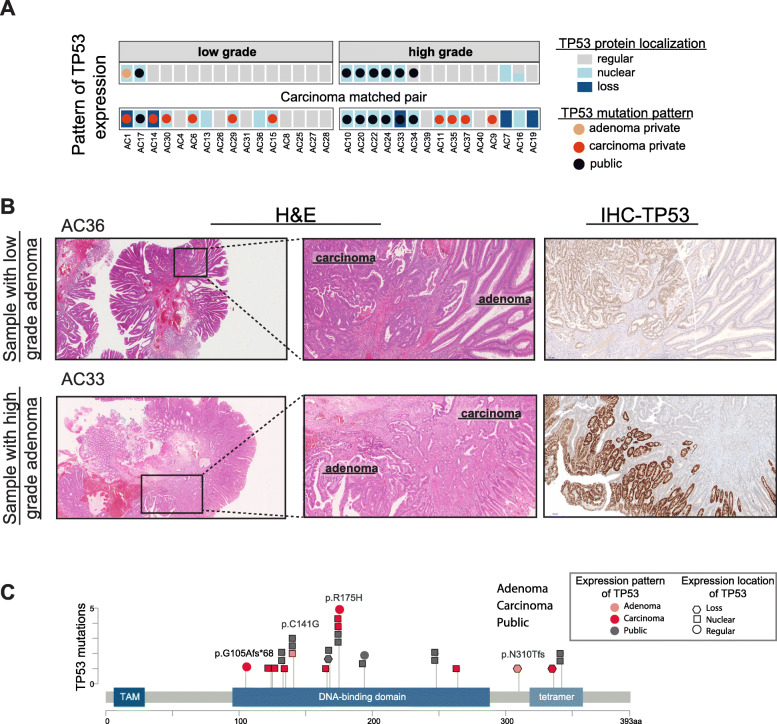
Fig. 3.
TP53 mutation and expression are altered in high-grade adenoma. a Overview of TP53 expression patterns with mutation information from MSS samples. Gray represents regular expression, light blue corresponds to nuclear accumulation, and dark blue is a loss of expression. See the “Methods” section for grading of TP53 staining. b Representative H&E and immunohistochemistry (IHC) images of TP53 expression in samples with low-grade (AC36) and high-grade (AC33) adenomas. H&E squares in the left-hand panels are magnified in the middle panel. c Location of mutations within the TP53 gene along with the expression/staining pattern. TAM, transactivation motif (figure is made using MutationMapper Cbioportal)

