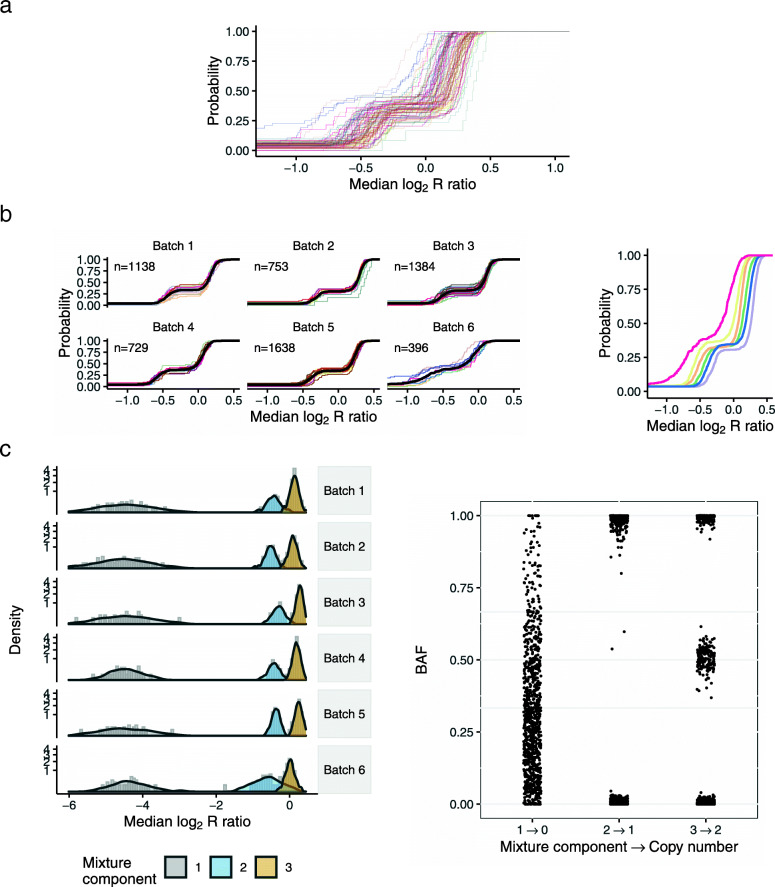
Fig. 2.
Identification of batch surrogates. a Plate-specific eCDFs of the average log2R ratio for a region on chr5 (155,475,886-155,488,649bp). b The plate-specific eCDFs were grouped by Kolmogorov-Smirnov test statistics, forming batches. The batch-specific eCDFs after grouping plates (right). The eCDFs between batches typically differed by a location shift, though here Batch 6 also captured samples with higher variance. c Single- and multi-batch mixture models were evaluated at each CNP. Densities from the posterior predictive distributions overlay the histograms of the 3-component multi-batch model (left). Adjusted for batch, only three components were needed to fit the apparent deletion polymorphism. B allele frequencies were used to genotype the mixture components. The mapping from the mixture component indices to copy number is indicated by the arrows on the x-axis labels (right)

