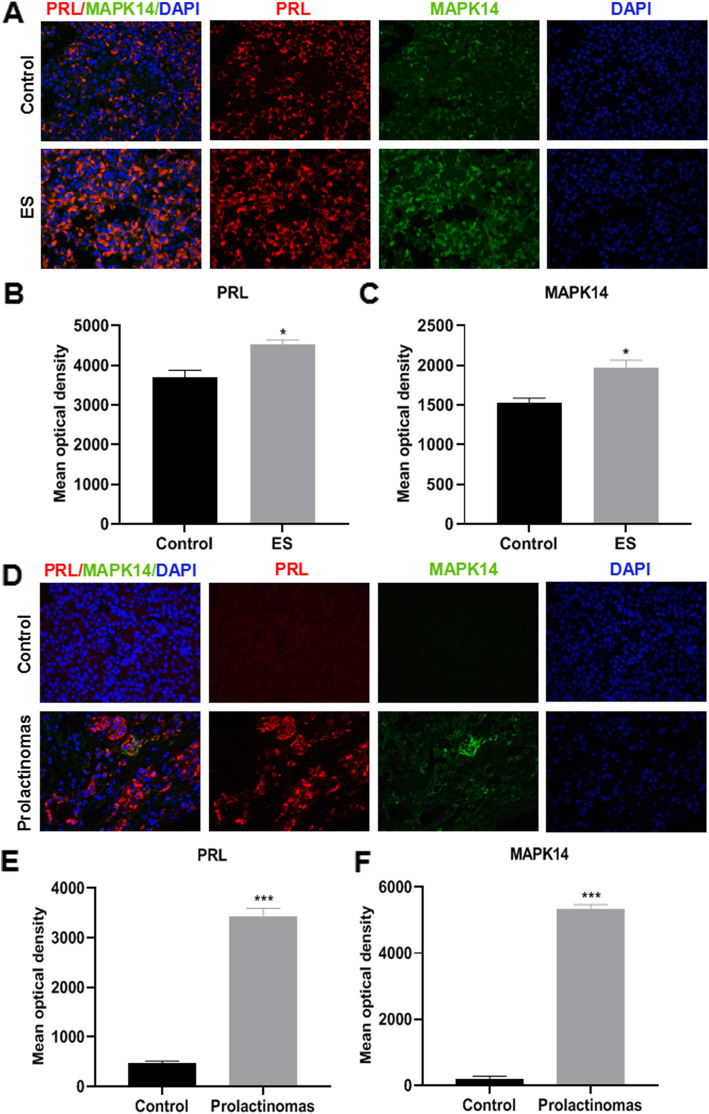
Fig. 1.
Immunofluorescence assay of PRL and MAPK14 protein expression levels. (magnification × 400). a PRL and MAPK14 immunofluorescence analysis of pituitary gland tissues from the control and prolactinoma model mice. b and c Mean optical density value of PRL and MAPK14 protein expression *P < 0.05 vs. Control group, (n = 4). d PRL and MAPK14 immunofluorescence expression of the pituitary gland in human PRL negative specimens and human prolactinoma specimen. e, f Mean optical density value of PRL and MAPK14 protein expressions were quantitatively examined by image analysis system. ***P < 0.001 vs. Control group, (n = 4). Red PRL; Green MAPK14; Blue DAPI

