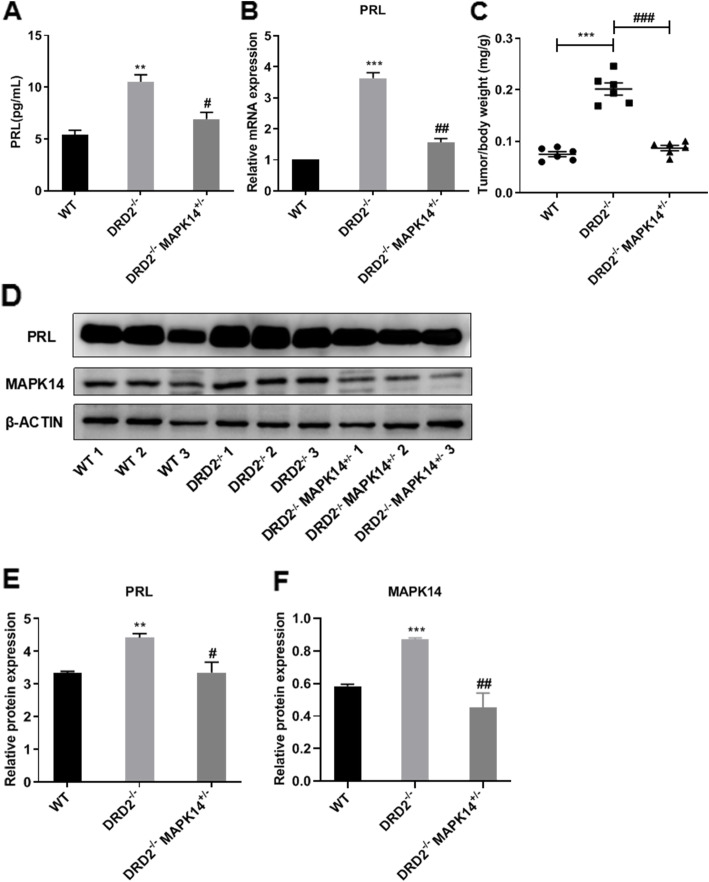
Fig. 3.
Effects of MAPK14 knockout on the development of prolactinoma in DRD2−/− mice. a Plasma PRL levels in WT mice, DRD2−/− mice and DRD2−/−MAPK14+/− mice. **P < 0.01 vs. WT mice; #P < 0.05 vs. DRD2−/− mice, (n = 3). b Relative PRL mRNA expression levels in the pituitary gland of mice. ***P < 0.001 vs. WT mice; ##P < 0.01 vs. DRD2−/− mice, (n = 3). c Pituitary gland weight/body weight ratio. ***P < 0.001 vs. WT mice; ###P < 0.001 vs. DRD2−/− mice, (n = 6). d PRL protein expression levels in the pituitary gland of mice. e Relative PRL protein expression levels were quantified and normalized to β-actin. **P < 0.01 vs. WT mice, #P < 0.05 vs. DRD2−/− mice, (n = 3)

