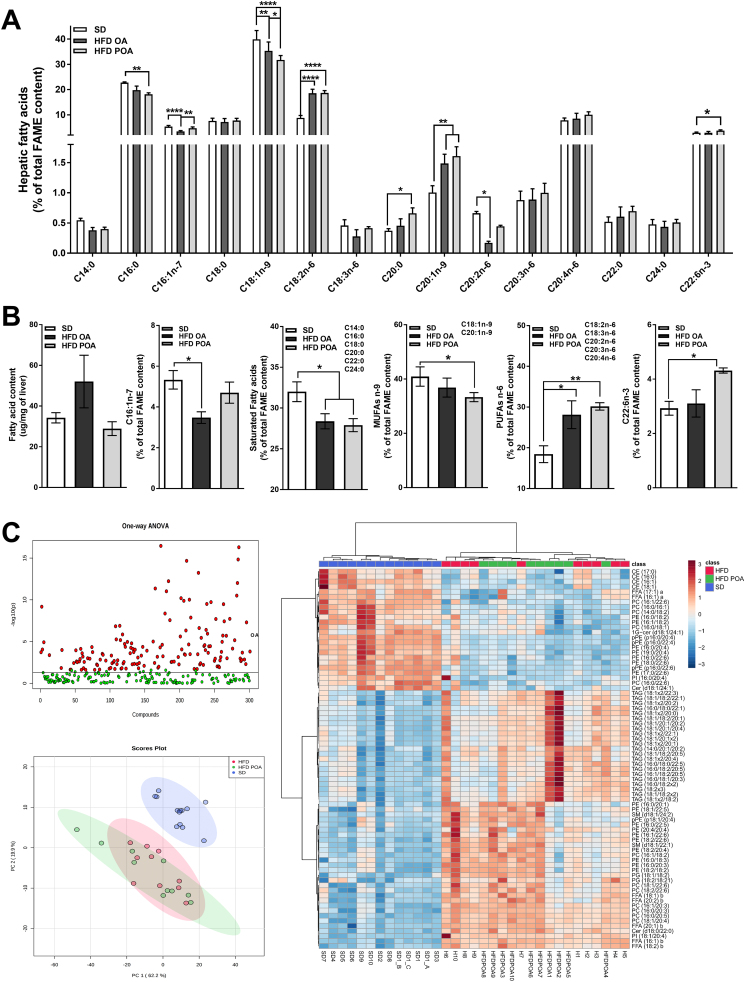
Fig. S2.
POA was successfully incorporated into liver but lipidomic does not show a clear segregation of the HFD-fed mice with or without POA treatment. Full panel of fatty acids species, measured by gas chromatography (GC), incorporated into the liver of wild-type (WT) mice fed with a standard diet (SD), high-fat fed mice treated with oleic acid (HFD OA) or palmitoleic acid (HFD POA) (A) (n = 5); liver content of total fatty acids (μm/mg of liver) (first graph), palmitoleic acid (C16:1,n-7) (second graph), total lipid species of saturated acid (third graph), total lipid species of monounsaturated n-9 fatty acids (MUFA n-9) (fourth graph), total lipid species of polyunsaturated n-6 fatty acids (PUFA n-6) (fifth graph), and Docosahexaenoic acid (C22:6, n-3) (sixth) estimated by GC (B) (n = 5); full panel of liver lipid species obtained by lipidomic (C) (n = 5). The data are presented as the mean ± SEM (n = 5). *p < 0.05, ⁎⁎p < 0.01, ⁎⁎⁎p < 0.001 ****p < 0.0001 vs. indicated groups. (One-way ANOVA followed by Bonferroni correction).

