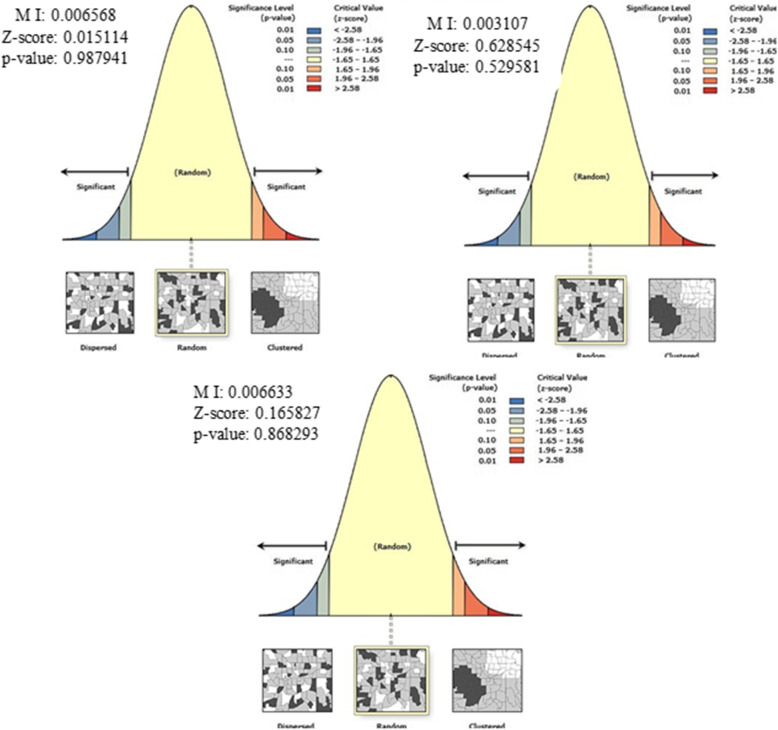
Fig. 10.
Spatial analysis of Geographic Weighted Regression in Ethiopia, EDHS 2005, 2011 and 2016 EDHS 2005, 2011 and 2016. The right panel represents for 2005 EDHS, the middle panel represents for 2011 EDHS, and the left panel represents for 2016 EDHS. The right part of the panel indicates dispersed, the central part of the panel indicates random, and the left part of the panel indicates clustered. In this study, residuals of GWR are distributed randomly in all periods. The random pattern on the middle side of the panels indicates that spatially uncorrelated residuals in GWR analysis of the study periods. The output has automatically generated keys on the upper right side of the panel as well as in the underneath reveals that; the pattern does not appear to be significantly different than random. [Shape file source: (CSA, 2013; URL: https://africaopendata.org/dataset/ethiopia-shapefiles); Map output: Own analysis using ArcGIS 10.7 Software]

