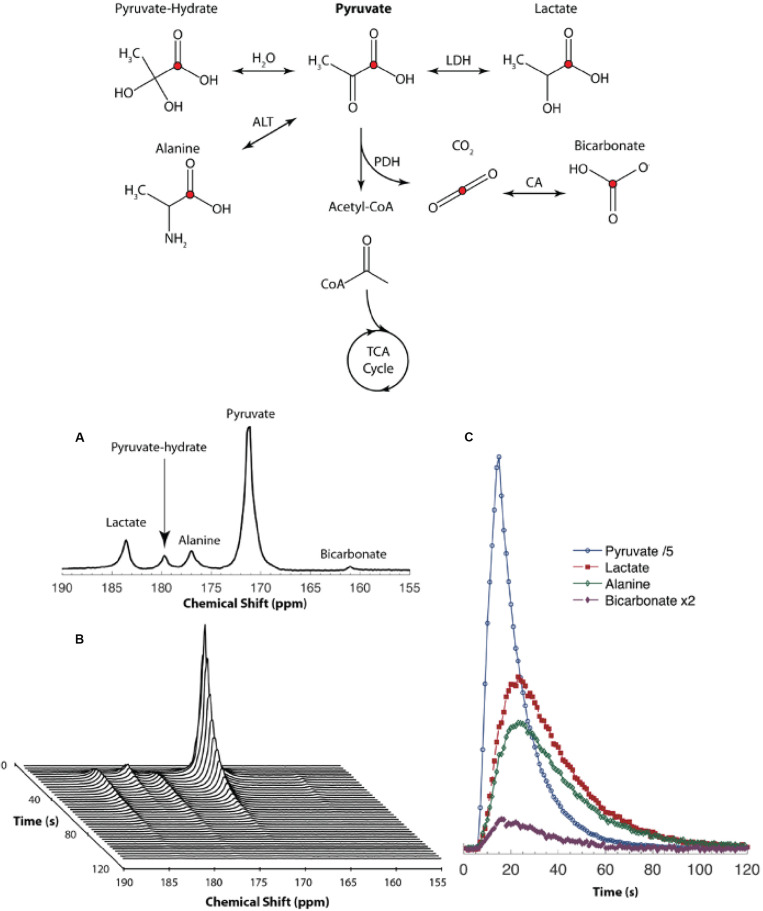
FIGURE 6.
(Top) Metabolites and their biochemical pathways that can be interrogated using [1-13C] pyruvate. MRI. The red circle indicates atoms with 13C labeled nuclei. The fate of the pyruvate beyond Acetyl-CoA into the Tricarboxylic Acid (TCA) cycle cannot be probed using [1-13C] pyruvate as the 13C labeled nucleolus remains on the 13CO2 molecule. Cofactors are not shown in this diagram for simplicity (LDH, lactate dehydrogenase; ALT, alanine transaminase; PDH, pyruvate dehydrogenase; CA, carbonic anhydrase). (Bottom) (A) NMR spectrum obtained from a mouse after administration of hyperpolarized [1-13C] pyruvate via the tail-vein. (B) Spectra obtained every second shows how different peaks vary over time. (C) Area under each peak depicted as a function of time to represent the relative concentration of each peak. Reproduced with permission from Pourfathi (2019).

